


Do you remember using a scantron sheet when taking a standardized test? Did you ever feel uneasy when you would fill out 5 As in a row and start doubting your answers? Were you confident in your answers, or were you like me thinking that I must be getting a lot of questions wrong, forcing me to question my answers?
Today, we have machine learning classifiers that look at an image and output a label. For example, if I input several random pictures of dogs, cats, airplanes, and cars, the classifier probably outputs labels of dogs, cats, airplanes, and cars. However, the classifier does not track the number of times an airplane appears, or even understands the fact that it is probably highly unlikely to see more planes than cars on a highway during rush hour; the model doesn’t care that there are 5 As in a row. We as humans see a lot of patterns occurring in our day-to-day lives, even in cases when there is no pattern. If we see a scenario that breaks away from the usual pattern we expect, such as seeing no traffic in New York or California, we instantly sense that something is off. We will still go on with our day, but with the knowledge that our predicted pattern is wrong.
This intuition can extend to the predictions of a model as well. If a model was trained on a dataset of cat and dog pictures that was evenly distributed between the two classes, we should expect that the predictions it makes should also be roughly evenly distributed between “cat” and “dog.” If, instead, the model was predicting “dog” 90% of the time, we might suspect something was wrong. Specifically, this could indicate that something changed between the distribution of data used for training and the data the model is being tested or deployed on. This phenomenon, dubbed distribution shift (or sometimes concept drift), can signal that the data the model was trained on is out of date and should be updated.
The Common types of Distribution shift
Label shift occurs when the distribution of labels in the training set is different than the distribution of labels in deployment. For example, there may be a scenario where we train on the CIFAR-10 dataset, which is a dataset that has a uniform label distribution (1/10 of the images are airplanes, 1/10 of the images are cars, etc.). However, when we transfer the model to real-world use, there may be more images of cars seen than airplanes (9/10 of images seen are cars, 1/10 of images seen are airplanes).
Covariate shift occurs when the distribution of inputs (e.g., images) varies between training and deployment. For example, if a model was only trained on images of cars in a city and then transferred to classify images of dune buggies in a desert, the model may struggle to classify these dune buggies as cars since these images are significantly different than the images it was trained on. We will dive deeper into covariate shift in a future blog post.
Detecting shifts in label distribution
In an ideal world, machine learning systems could automatically detect changes in data distribution and flag users or developers if a significant shift is detected. However, there are two issues that complicate this approach. First, users don’t generally have access to the true labels at test or deployment time, only the model’s predictions. Second, the inputs and predictions are received sequentially and there can be real benefit to detecting a change in distribution as soon as possible. If a model trained to classify handwritten digits predicts five instances of the digit “3” in a row, that’s not unusual. But if the model predicts five hundred instances of “3” in a row, then a human observer should be suspicious. As part of the VennData project, IQT Labs developed a detection method that automates this intuition. Starting with information about the expected distribution of predicted labels, gleaned from the training data, the algorithm keeps a running tally of how often the underlying model predicts each class. Then, by leveraging ideas from Kalman filters and the law of large numbers, the algorithm computes a running score that increases with the difference between the expected label distribution and the observed distribution. A hard threshold can be applied to this score for detection of distribution shift, and the value of the threshold trades off false positives and false negatives.
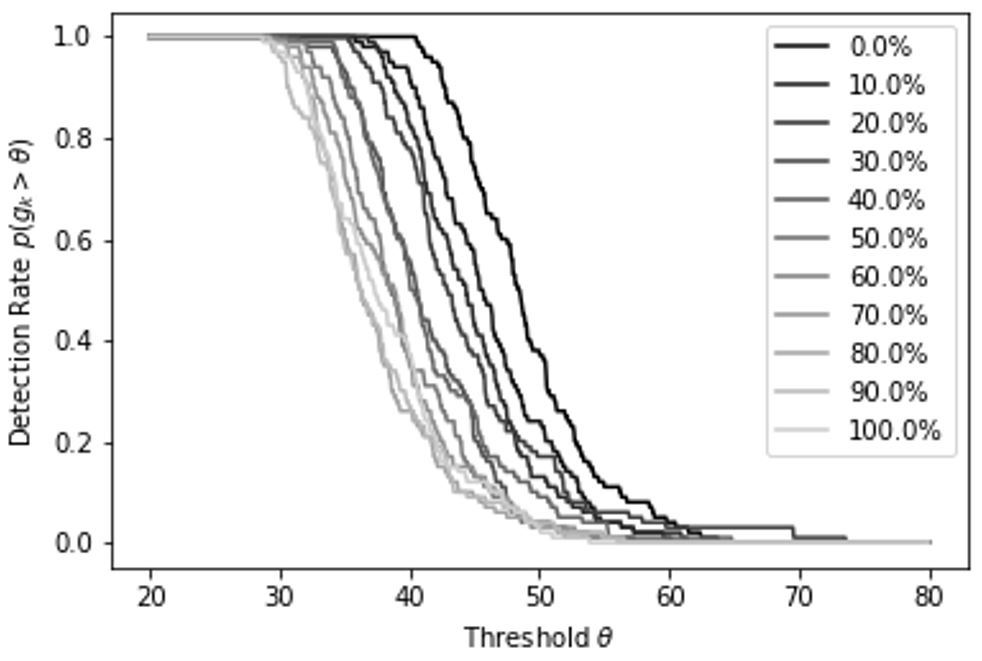
To demonstrate our method, we applied it to the MNIST database of handwritten digits. We took models that were trained on the full, balanced training set and deployed them on versions of the test where varying percentages of the “zero” examples were removed. Samples were fed into the classifier sequentially. We estimated the probability that shift detection occurs within the first 1,000 samples of the test set for varying values of the threshold across many random samplings of test data. While far from the state of the art, this simple method can still detect shifts in label distribution.
Looking Forward
There are many stumbling blocks that can hinder the adoption of machine learning for critical applications, including distribution shift. There can also be issues with data quantity and quality. As we look to deploying artificial intelligence for solutions in ever more complex domains, it will require a combination of statistical thinking and domain expertise to ensure these systems meet our standards of safety and accountability. We invite readers to try out some of the code developed for this project and follow this blog as we dive deeper into distribution shift.