

Introducing Atlas: A Tool for Visualizing Deep Tech Relationships at Scale

IQT is pleased to release Atlas, a general-purpose visualization tool for creating and exploring interactive graphs in a browser.
Built using Python and Dash Cytoscape, Atlas transforms your data into nodes and edges, allowing you to explore part-to-whole and part-to-part relationships. Want to map out a startup ecosystem to see who’s who in a high-growth segment of the marketplace? Looking to analyze patent citation networks or venture investing networks? Working with another set of connected entities that might be easier to define in terms of nodes and edges? Atlas has you covered.
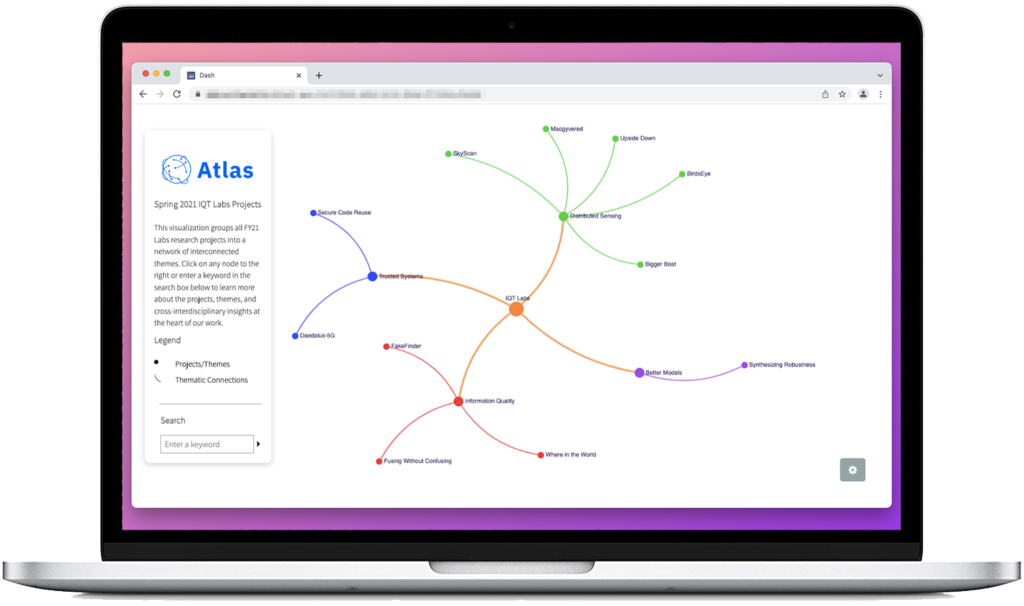
We built Atlas originally as a tool for keeping track of IQT Labs projects and research themes (example above), yet soon realized this visualization capability could help colleagues and mission partners explore technology innovations and Mission Economy startups. To make the tool more robust, we enlisted the help of the IQT Software Development Team, which transformed our initial proof of concept into a more user-friendly visualization tool for general audiences.
We recently open sourced Atlas and have begun accepting contributions to our public and internal repositories.
Why Use Atlas?
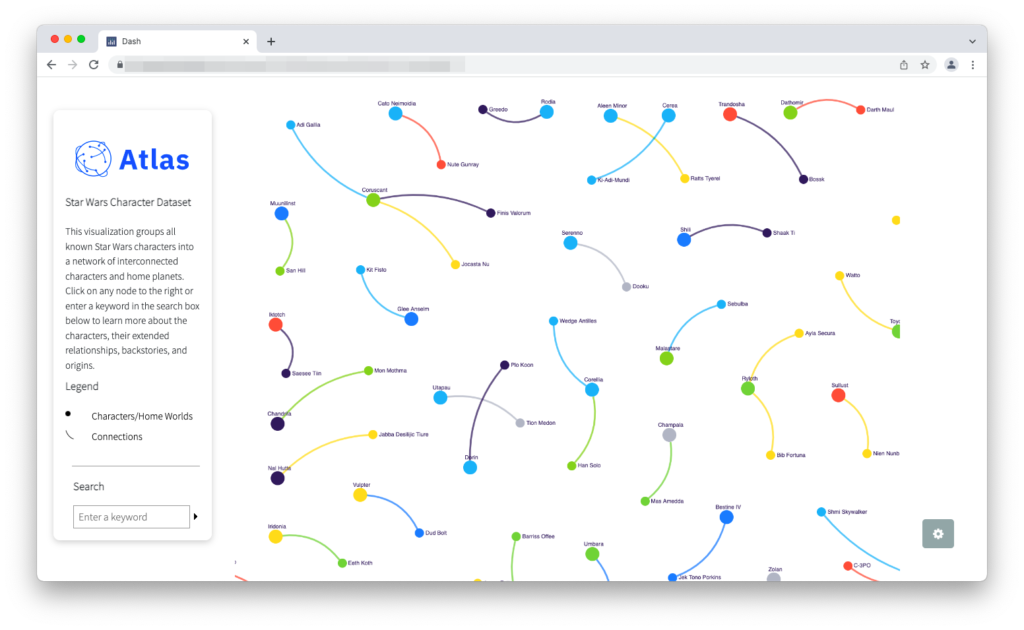
A lightweight, user-friendly tool for graph data exploration, Atlas can ingest and display datasets consisting of tens of thousands of nodes with the ability to zoom, resize, and rearrange the entire graph in a matter of seconds.
While there are several existing software libraries with similar capabilities (such as Gephi and Sigma.js), Atlas differs in that it not only visualizes nodes and edges, but also provides contextual information and node metadata on demand. For instance, nodes can link to GitHub codebases, YouTube videos, or FactSet company listings, among other multimedia documents.
In addition, Atlas allows graph-to-graph linking, enabling users to disaggregate complex datasets into audience-specific views, which makes data storytelling easier.
Main Features
The Atlas user interface (UI) organizes individual graph visualizations into cards, as shown below:
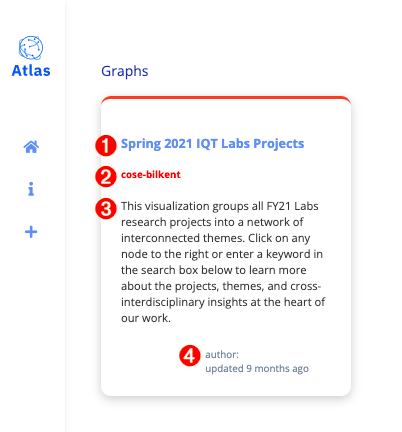
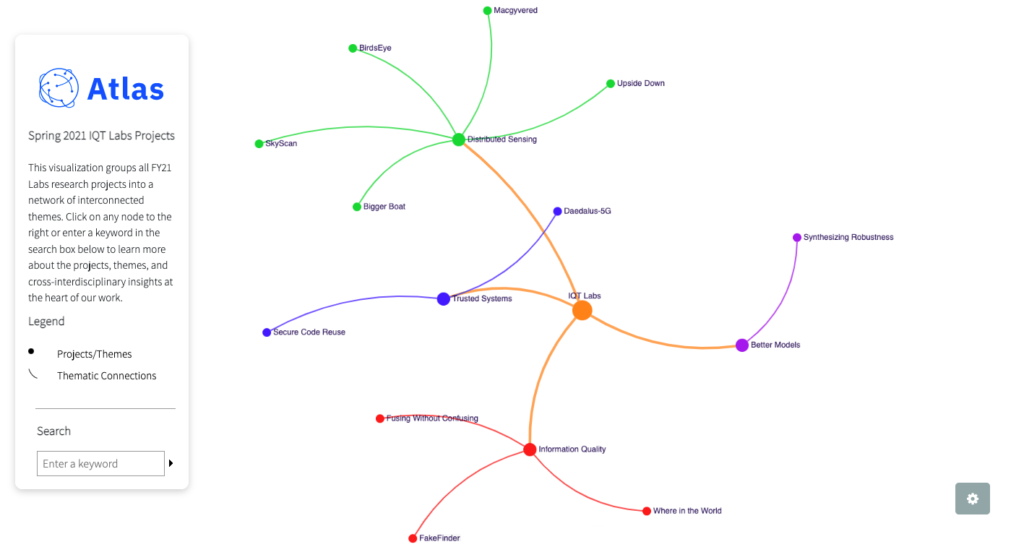
Clicking on a card takes you to the corresponding Atlas visualization, where you can explore individual nodes, search for keywords of interest, modify graph settings, and view additional data associated with a node by clicking on it.

Creating Your Own Atlas Visualization
Atlas gives users several options to define their preferred operating environment, input data structure, and visualization output format.
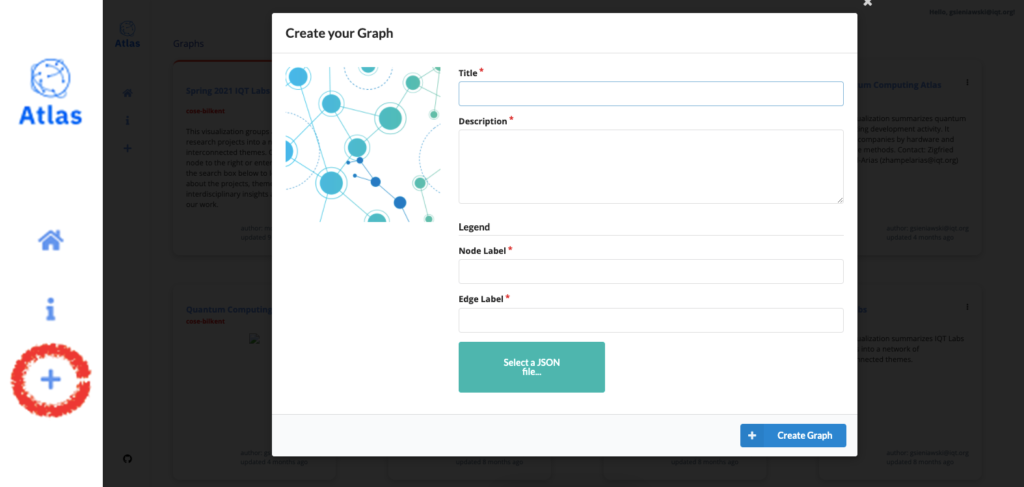
Once you’ve installed Atlas, the easiest way to get started is clicking on the plus icon (+), filling out four required fields, and loading a JSON file containing your data.
You then select from five different layout options below, accessible by clicking on the settings gear at the lower right-hand corner of your Atlas visualization.
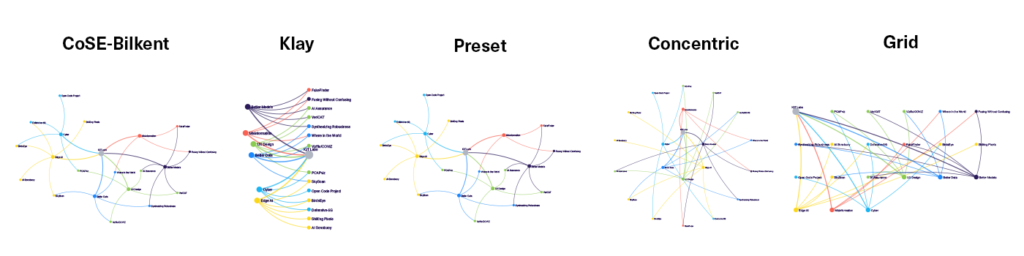
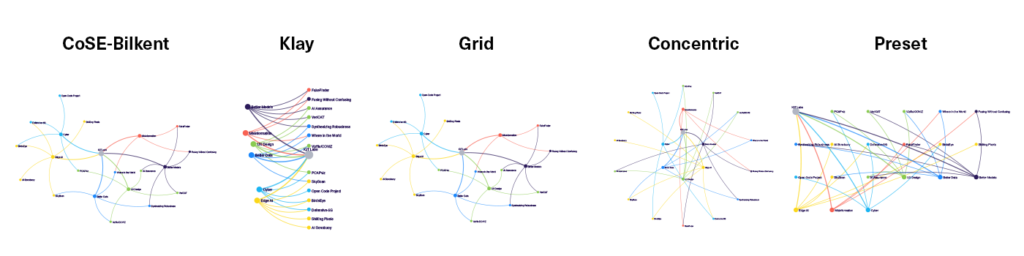
Alternatively, you can run Atlas locally using Docker, which provides 13 layout options. For setup instructions, check out the Atlas Developer Quick Start Guide.
Atlas can read in two types of JSON data structures: an array of defined nodes and edges or an array of child/parent relationships. For convenience, the Atlas README provides an example of each.
A Final Word of Caution

While Atlas can handle datasets consisting of tens of thousands of nodes, it’s easy to go overboard here. As a group of IQT colleagues noted several years ago:
“As networks [of nodes and edges] become larger and more complex, maintaining legibility is challenging… Without a fixed visual reference point, it is nearly impossible for humans to use this type of display to make a visual comparison of different states of the network. (e.g., Discovering when new nodes have appeared is confusing at best, impossible at worst.) Additionally, the same network data can look very different, depending on parameter settings.”
For this reason, we recommend making judicious choices about how many nodes and edges you include in your dataset to avoid creating illegible visualizations in Atlas.
Although Atlas grew out of an IQT Labs project exploration use-case, we imagine the tool could be adapted for other applications where users would benefit from the ability to explore relationships among nodes and edges. If you are interested in using or adapting Atlas, please check out this code repo and README, which are available to the public for reuse/modification under the Apache 2.0 License.
Please note that we are not responsible for what you do with Atlas. When you load your own datasets in Atlas, you are responsible for managing the security, integrity, access control, and intellectual property rights associated with your data. There is no warranty of any kind provided with the information, code, and binaries in the Atlas repo. Neither IQT nor IQT Labs are available to provide maintenance or support. You are solely responsible for your usage of Atlas.
Related blog posts
To learn more about prior work in related areas, please check out:
- ArQ Gatekeeping, IQT Blog, Dec. 2020
- Organizing Deep Tech at Scale, IQT Blog, Nov. 2020
- Dataviz.cafe: Find the right tool to visualize your data, announced Oct. 2019