

Measuring Global Bio-Power: The Strengths and Limits of Using Open Source Software Metadata to Analyze Worldwide Technical Trends

The study of global technical trends–especially through patents and academic citation data–has picked up steam in recent years as some observers have come to view international politics as a struggle to command the heights of key emerging technologies. Georgetown University’s Center for Security and Emerging Technology (CSET) has, for instance, created the Map of Science project that organizes scholarly literature by research clusters. CSET analyst Sara Abdulla has even used the Map of Science to explore bioinformatics, finding that the United States and China lead the world in the count of bioinformatics research papers.
One facet of this analytical agenda that deserves close examination is the relative merit of different data sources for understanding global technical trends. Scholarly publications, like those used in the Map of Science, have an obvious appeal because academic journals and conferences ideally filter out low-quality research and the highest quality research often garners a large body of citations. Patent data is also useful for understanding global technical trends given that a patent represents a publicly shared technical innovation deemed worthy of protection.
There’s another data source available though, one that captures an important aspect of modern technical innovation: open source software metadata. Platforms like GitHub and GitLab and software packaging ecosystems like the Python Package Index have become sites of internet-based software collaboration. Importantly, many modern technical trends such as data science, quantum computing, and bioinformatics—more on bioinformatics shortly—have become based, in large part, on free and open source software due to the understandable desire by researchers and software developers to borrow and reuse high-quality code rather than write their own code from scratch. Therefore, mining open source software metadata to understand global technical trends could be a worthwhile complement to more traditional approaches.
We therefore decided to explore the strengths and limits of using open source software metadata derived from GitHub to understand global trends in bioinformatics. We assembled two separate lists of relevant open source bioinformatics software packages
- Onederived from Bioconda, a popular bioinformatics software repository, and
- One derived from open source bioinformatics GitHub repositories mentioned in the top-tier journal Oxford Bioinformatics.
We then created a dataset of the top contributors to these projects and the contributors’ self-reported geographic locations via the open source tool GitGeo. Finally, we used a mixture of basic data analysis, mapping, and network analysis to understand country-by-country trends in bioinformatics.
Our key findings include:
- Many U.S.- and Europe-based contributors; few China-based contributors. Only 1% of contributors in the Bioconda analysis and 2% in the Oxford Bioinformatics analysis reported their location as China. The respective percentages for the United States and Europe were 24% and 21%.
- The Bioconda analysis suggests dense U.S.- and Germany-based contributor networks and a loose network in China. The Oxford Bioinformatics analysis, however, finds a dense China network. This finding points to the possible existence of an interconnected China-based bioinformatics ecosystem independent of Bioconda. This revelation also points to the sensitivity of open source software metadata global technology analysis to the corpus that is analyzed.
The remainder of this post explains these findings, which some may find counterintuitive given that past citation data analysis concluded that China-based researchers are prolific in the bioinformatics field. We also provide a section on analytical details related to data acquisition and analysis.
The Global Picture: Many U.S.- and Europe-Based Contributors, Few from China
Past analysis using academic citation data has found that the United States, China, and the UK lead the world in bioinformatics papers. Our analysis, at first glance, paints a different picture. We analyzed the count of the top open source bioinformatics contributors in each of our datasets, which resulted in Figure 1.
Figure 1. Global Map of Open Source Bioinformatics Contributors.
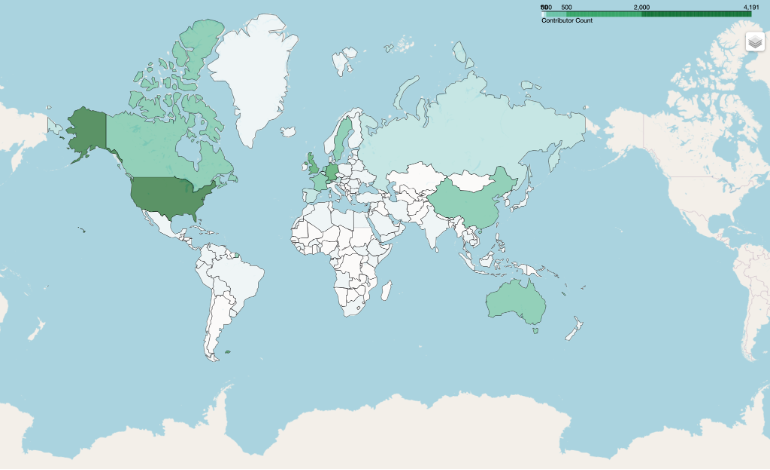
Bioconda 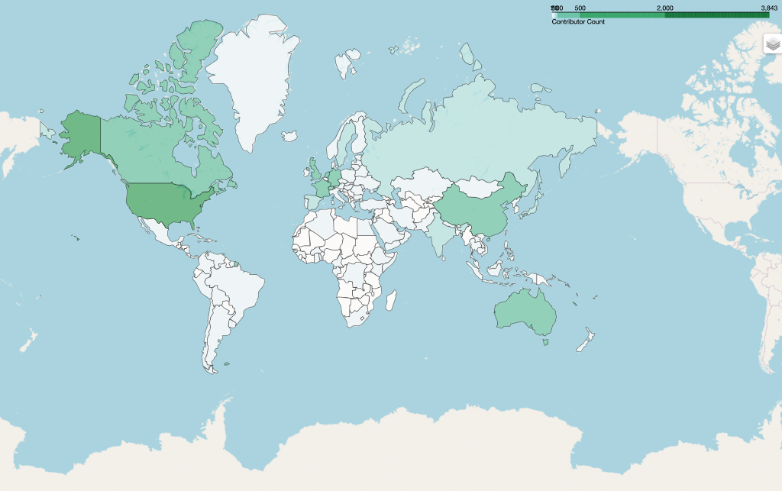
Oxford Bioinformatics
Table 1 lists the top 10 countries for each dataset using two different sampling approaches. The first approach uses all contributors while the second only counts the 100 most influential contributors. Influence was defined as the ranking of the contributors based on the strength of their connection to other well-connected contributors, using Google’s PageRank algorithm.
Table 1. Contributor Count by Country and by Sampling Approach
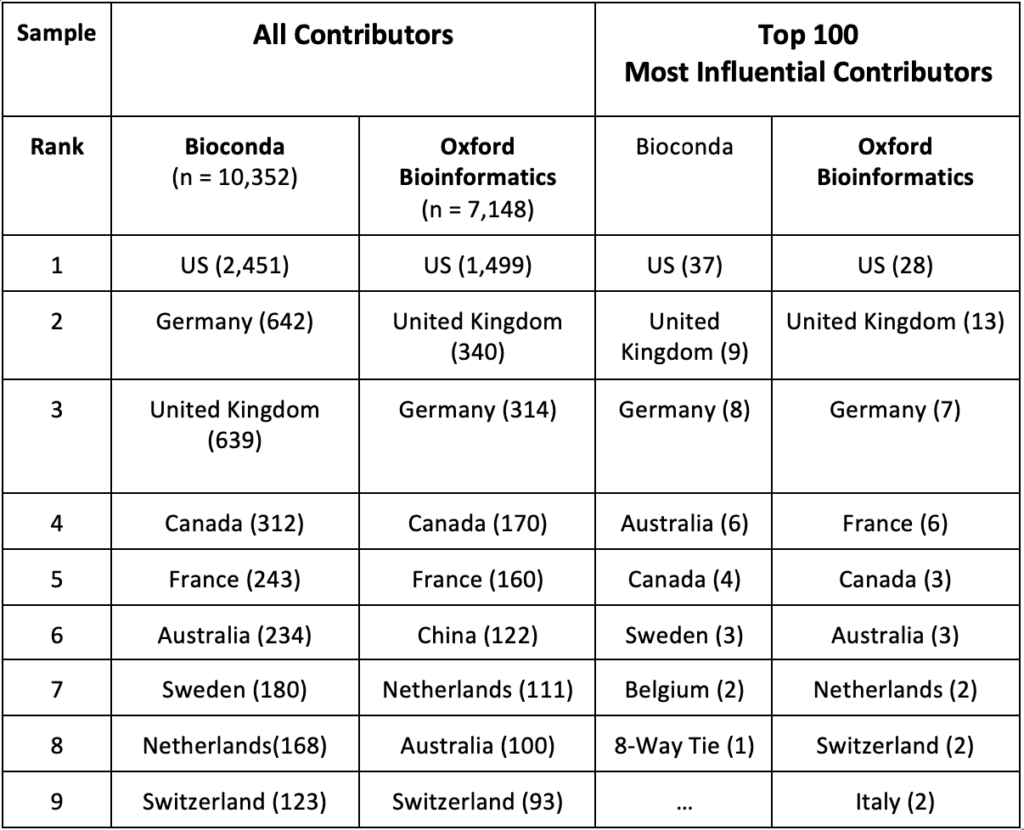
In both datasets and across both approaches, the United States, Germany, and the UK had the highest counts of contributors. When sampling all contributors, the analysis found that China-based contributors amounted to only 4% of the U.S. total for Bioconda and 8% of the U.S. total for Oxford Bioinformatics. There were no China-based contributors among the 100 Most Influential Contributors in either dataset.
As this finding contradicts CSET’s analysis, we decided to cross-examine our results. Our initial hunch–for which we found evidence–was that China-based researchers have made major inroads into bioinformatics in only the past few years; our GitHub analyses, which use data stretching back more than a decade, fail to capture this recent phenomenon. We therefore decided to do two checks.
First, we performed a manual check of recent Oxford Bioinformatics authors and the country location of their affiliated institution. We examined the first author (who traditionally does the bulk of the work) and the last author (often the principal investigator) of two Oxford Bioinformatics issues from January 2022 and recorded the country affiliated with their institution. We predicted that a significant fraction of these authors would be from institutions located in China. In fact, 24% (52/215) of these authors are affiliated with institutions located in China, consistent with CSET’s analysis.
Second, we examined the 100 most recently created GitHub repositories in Bioconda and those associated with Oxford Bioinformatics. For Bioconda, this included repositories created after December 2019; for Oxford Bioinformatics, this included repositories created after November 2020. Analysis of this recent dataset revealed an increase in China-based contributors: for Bioconda, two of the top 100 most influential recent contributors were China-based, and for Oxford Bioinformatics, 23 of the top 100 most influential contributors were China-based. This result contrasts with our previous findings that–analyzing the entire time range–none of the top 100 contributors were China-based using either dataset. The Oxford result is consistent with our author analysis for the most recent Oxford Bioinformatics issues, which strengthens our analytic confidence in the usefulness of our open source software metadata analysis.
It therefore seems possible that the open source software metadata approach we employed might under-emphasize China-based contributors because of the recency of contributions.
Future analysis should also investigate two other alternative hypotheses. First, there could be systematic cultural differences between researchers and software developers in different countries in their proclivity to create and maintain open source software repositories and packages. If so, it could be that the results we present merely reflect a U.S. and European penchant for creating and maintaining open source software. Second, it is also possible that contributors from different countries have a different likelihood of listing their location, skewing GitGeo’s results. In other words, perhaps China-based contributors are less likely to include their location in their GitHub profile.
Dense U.S. and German Networks. For China, It Depends.
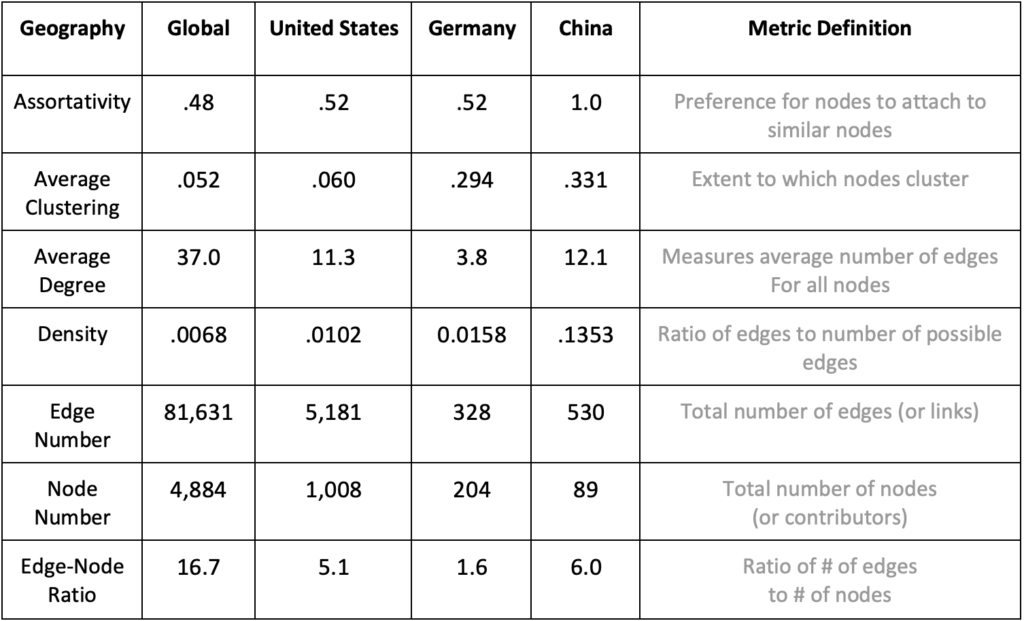
We also examined the contributor datasets via network analysis, calculating typical network connectivity metrics. Table 2 presents the metrics for all contributors and separately the U.S.-, Germany-, and China-based contributors using the Bioconda dataset. We chose Germany because of its high contributor count and location in Europe. The rightmost column contains a definition of each metric. This analysis treated each open source software contributor as a node and the number of joint repositories as edges. We created an analytical software called gitnet (which relies on the Python network analysis package NetworkX) to perform these calculations.
Table 2. Network Connectivity Metrics by Geography for the Bioconda Dataset
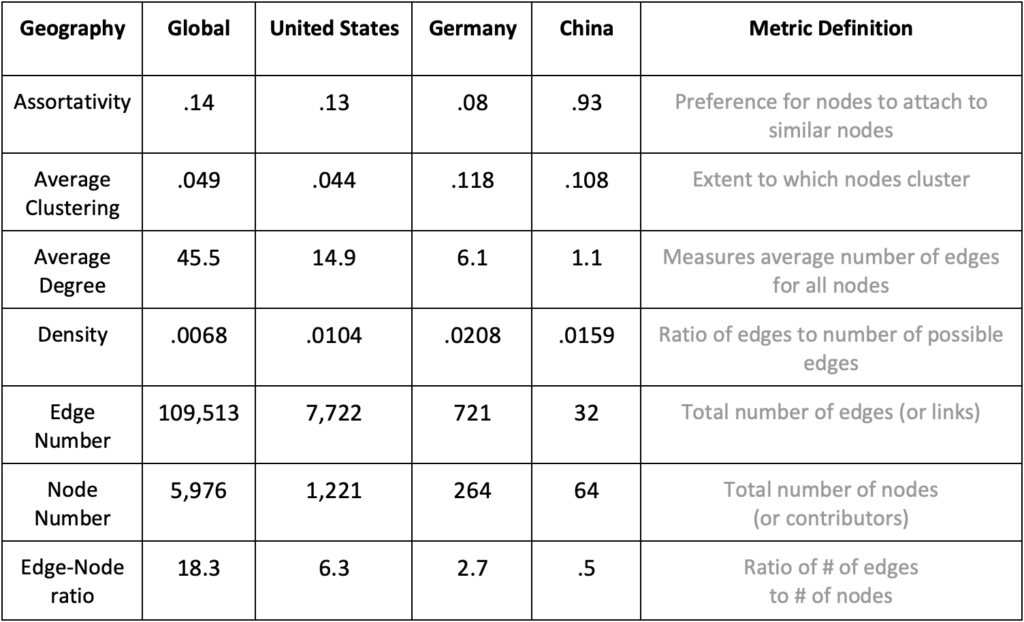
Strikingly, the edge-to-node ratio for U.S.- and Germany-based contributors (6.3 and 2.7) far outstrips the ratio for China-based contributors (.5). A glance at the raw count of edges (i.e., collaborative links) for China-based contributors finds that there are only 32 connections among contributors. That Chinese contributors have so few connections among each likely explains the relatively high assortativity value for China (.932). In other words, Chin-based contributors in this dataset do not appear to collaborate with each other and instead work on open source software packages with contributors from other countries. The average degree statistics corroborate this analytical story.
To double-check these findings, we performed the same network analysis using the Oxford Bioinformatics dataset, which resulted in table three.
Table 3. Network Connectivity Metrics by Geography for the Oxford Bioinformatics Dataset
While the number of China-based contributors is relatively small (n = 89) compared to U.S.-based (n = 1,008) and Germany-based (n = 204) contributors, the Chinese network has the highest edge-to-node ratio, the highest density score, and the highest average degree value. In short, these findings are the opposite of the Bioconda analysis. Why the discrepant findings? One straightforward theory is that there is simply an interconnected group of bioinformatics researchers in China who are operating independent of Bioconda. For those who want to study trends in Chinese bioinformatics, Bioconda may not be the appropriate repository for investigation.
Methodical Readers Only! – Methodology Section
For those readers inclined to understand the analytical details, this section explains several key aspects of our methodology.
For the Bioconda analysis, we extracted GitHub open source contributor data from the entire Bioconda recipes ecosystem. We cloned bioconda-recipes and parsed unique Github URLs from the meta.yaml files. This parsing can be replicated via the Bioconda functionality found in the deps2repos tool. The Oxford Bioinformatics analysis required a variant of this process. We scraped all GitHub URLs found in all Oxford Bioinformatics articles.
We then used GitGeo to gather contributor location information for all repositories. GitGeo parses information that Github users optionally provide via a free-text box and returns the predicted country. For example, GitGeo would classify a user who entered “Los Angeles” as located in the “United States”. While GitGeo is far from perfect—a user who enters “North Pole” could be classified as in “North Korea”—a manual check determined that GitGeo accurately determines the user’s country approximately 95% of the time, assuming the user provides location information. Crucially, 60% of the 10,352 associated Bioconda contributors derived from 1,991 GitHub repositories provided location information. For the Oxford Bioinformatics analysis, 54% of 7,148 contributors from 2,028 GitHub repositories provided location information.
Finally, all network analyses involved a contributor-contributor network graph in which the nodes are unique contributors, and edges represent two users contributing to the same repository, weighted by the number of repositories to which the two users contributed. For the country-specific analyses, we pruned the networks to include only contributors from the countries of interest and performed each analysis independently.
Conclusion
On a tactical level, this analysis suggests that investigating global bioinformatics trends via open source software metadata (thanks to Bioconda, Oxford Bioinformatics, the GitHub API and tools like GitGeo) is possible. An analyst engaged in open source technical intelligence can plausibly mine software repositories for bioinformatics-related insights.
On a strategic level, this piece also suggests that findings derived from this methodology can be interesting and surprising. That China-based contributors to open source bioinformatics-related software number so few (while U.S.- and Europe-based contributors number so many) should at least intrigue those interested in global technical intelligence. And that there appears to be a cluster of interconnected China-based bioinformatics researchers operating via GitHub, but not Bioconda, should also pique an analyst’s interest.
Of course, CSET has previously found via their Map of Science project that China has the second largest count of bioinformatics papers. So are our findings wrong? We take a relatively broad-minded view: all methods for studying technical power are flawed but helpful. Of course, figuring out the flaws is the tricky part! We have suggested a few, including that our particular analyses don’t account for the potential recency of China’s contributions to bioinformatics and that there could be a U.S. and European researcher preference for publishing open source software. We invite critique of this methodology and suggestions on how to improve it. You can email us at labsinfo@iqt.org and leave ideas and questions related to GitGeo at our GitHub.
Finally, to recast a famous quotation from statistician George Box, all models of global bioinformatics trends are wrong, but some are useful. We hope this one is useful!