

Synthesizing Robustness YOLTv4 Results Part 1: The Nuances of Extracting Utility from Synthetic Data
How best to leverage small datasets for machine learning tasks is an active area of research. Synthetic data has the potential to alleviate object rarity and long-tail distributions, provided the synthetic data can be fully utilized.
IQT Labs’ “Synthesizing Robustness” aims to explore whether domain adaptation strategies (attempting to make the synthetic data look more “realistic”) can improve the efficacy of the synthetic data when it comes to localizing rare objects. In this post, we explore some initial results and some pitfalls with naive experiment design. We find that strategically augmenting the real dataset is nearly as effective as adding synthetic data in the quest to improve the detection or rare object classes, and that fully extracting the utility of synthetic data is a nuanced process.
1. Dataset and Experiment Design
In this section, we briefly review the RarePlanes dataset that was built and curated as a part of a recent IQT Labs project. This dataset consists of a large corpus of satellite imagery of airports around the world, with attendant precise aircraft labels. A large volume of synthetic imagery also is available to augment uncommon objects, (i.e., rare planes). See the RarePlanes paper or cosmiqworks.org for additional details. We should note that this specific dataset and experiment strategy was originally designed by Nick Weir, so big thanks to Nick, as well as to Jake Shermeyer, who curated the original RarePlanes dataset and study.
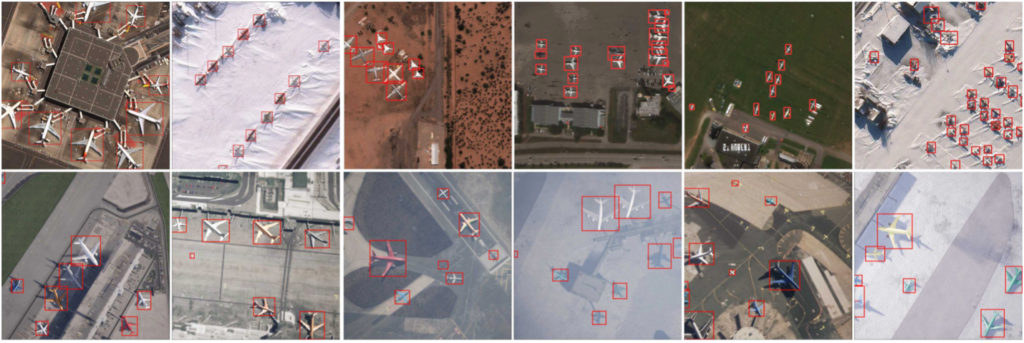
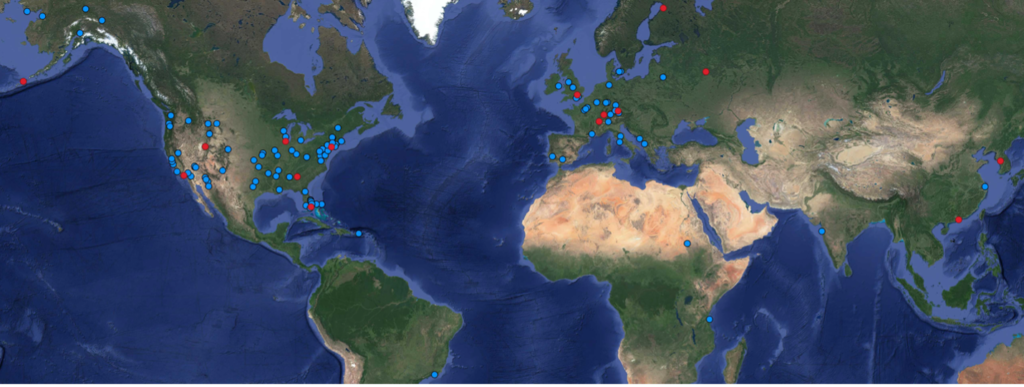
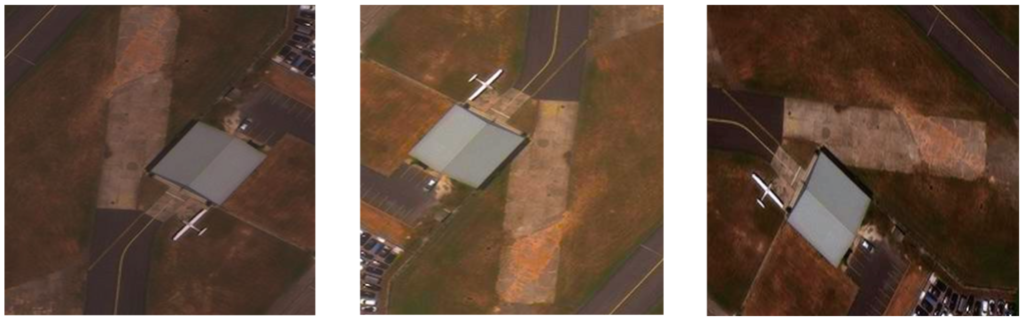
Recall that the dataset includes a multitude of collects (i.e., observations) of both real and synthetic data (Figure 1) from around the world (Figure 2).
We use a portion of the RarePlanes data centered primarily on overseas airfields. For this project we create a dataset according to the following rules:
- We select aircraft makes (e.g., MiG-29) that exist in both the real and synthetic dataset, and contain >100 observations in the real set. 14 aircraft makes meet this requirement.
- Any collect that contains at least one of the aircraft in #1 is included in the dataset.
- Any aircraft that is not one of the 14 aircraft of #1 but exists in the filtered dataset of #2 is labeled as ”Other” in both the real and synthetic datasets, yielding a total of 15 aircraft classes. There are originally 99 aircraft classes (from North American T-28 Trojan to Douglas C-47 Skytrain to Chengdu J-20), so the ”Other” aircraft class collapses 85 aircraft classes.
- Some of the makes are made rare in the training set by placing the majority of the given aircraft make in the testing set.
- Each collect is placed into either the training or test set, so an entire image is either in train or test.
Figure 3 shows the 14 aircraft classes, all of which are Russian or Chinese military makes, and span a variety of aircraft types from fighter aircraft (e.g., Chengdu J-7, MiG-31, Su-27) to heavy lift transport aircraft (e.g., Il-76).
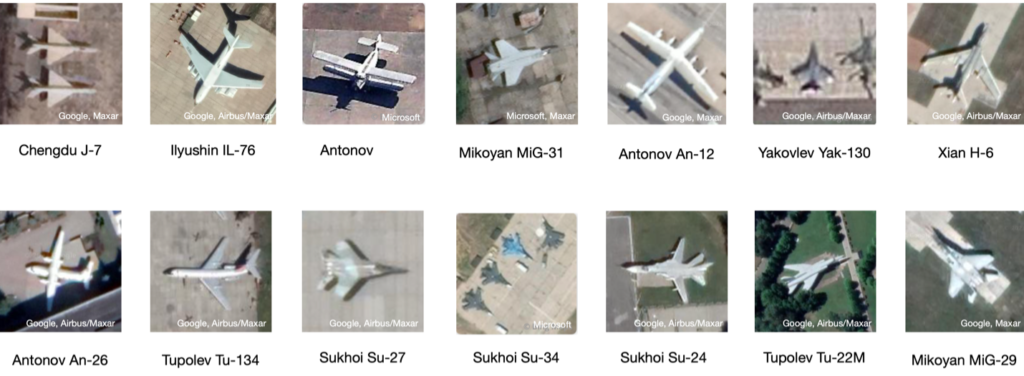
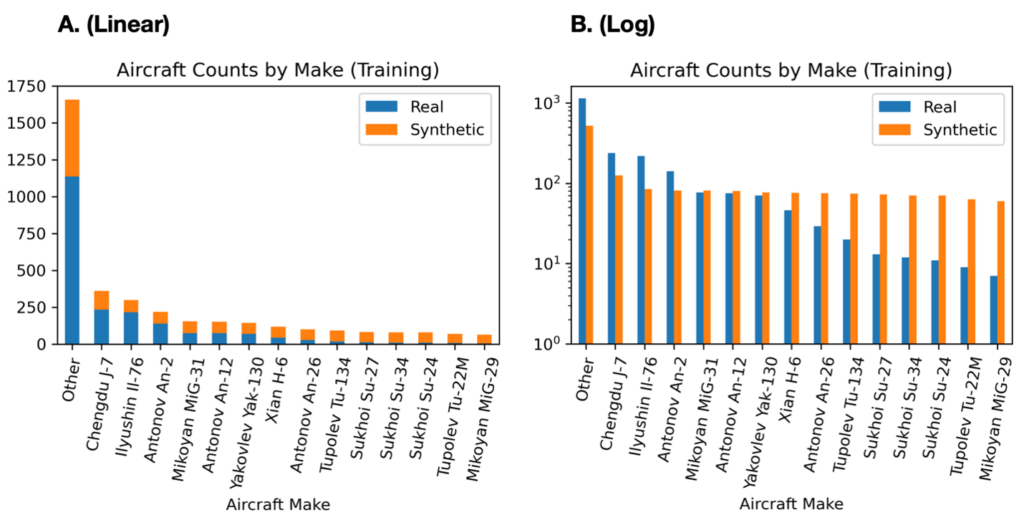
Figure 4 details the breakdown of the dataset by aircraft make. There are 2087 real aircraft, and 1595 synthetic aircraft, with the synthetic data heavily weighted toward rare aircraft. The catch-all “Other” category is highly over-represented in the dataset, accounting for 54% of the real aircraft (33% of the synthetic data). For the remaining 14 aircraft classes, real counts in the training set range from only 6 (MiG-29), to 236 (Chengdu J-7), so all aircraft are relatively rare. For the rare classes, Figure 4 illustrates that the majority of the data is synthetic.
Domain adaptation is applied to each synthetic image using the CycleGAN algorithm. CycleGAN step attempts to minimize the difference in appearance between the real and synthetic data, which we hypothesize will improve the utility of the synthetic data for localizing rare aircraft. See blog 1 for further details on the domain adaptation step.
There are 7396 aircraft in the test set, distributed over 164 unique collects, with each class having at least 80 aircraft present in the test set. We test on real data only.
With this dataset in hand, we can explore domain adaptation (DA) strategies on the synthetic data to see if such techniques improve our ability to detect rare aircraft.
2. YOLTv4 Model
We use the YOLTv4 framework, which combines the state-of-the-art YOLOv4 object detection algorithm with prior work in large-scale object detection in satellite imagery (YOLT, SIMRDWN). We use a YOLO backbone, since prior work (e.g., 1, 2) has shown YOLO to offer superior performance to other object detection frameworks (e.g., Faster R-CNN, SSD) in the satellite imagery context.
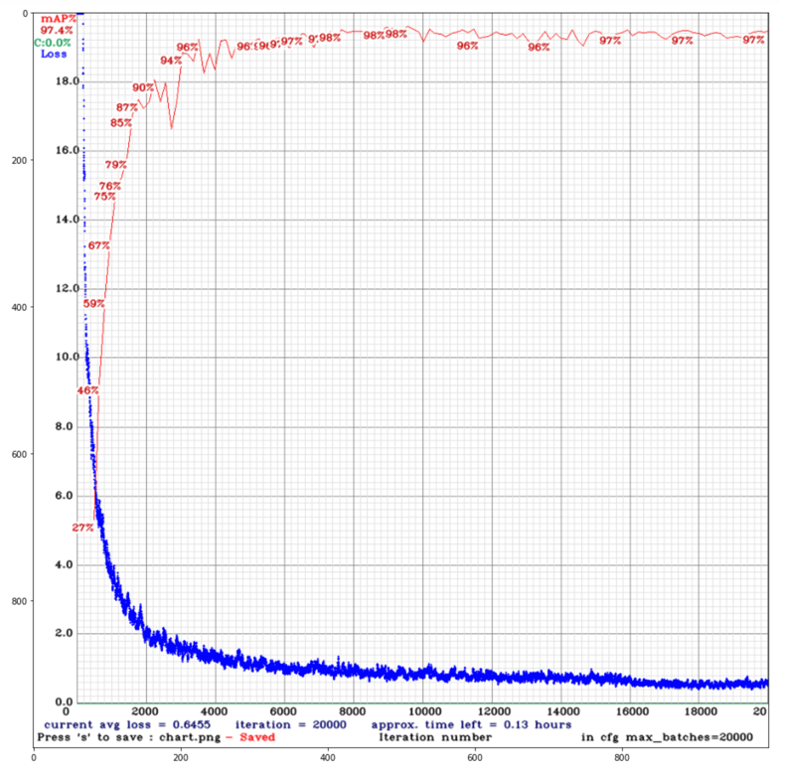
We train on 416 × 416 pixel image chips extracted from the original imagery (native imagery consists of large satellite image scenes hundreds of megapixels in size), with 1/6 of the training data reserved for validation. We train for 20,000 iterations, though the model converges far faster than this (see Figure 5).
Another reason (besides detection performance) for using the YOLO backbone is its speed: inference proceeds at 85 frames per second on a single V100 GPU. This speed is necessary given that our test set exceeds 3,000 square kilometers in area.
3. Results Part I: Initial Experiments and Statistics
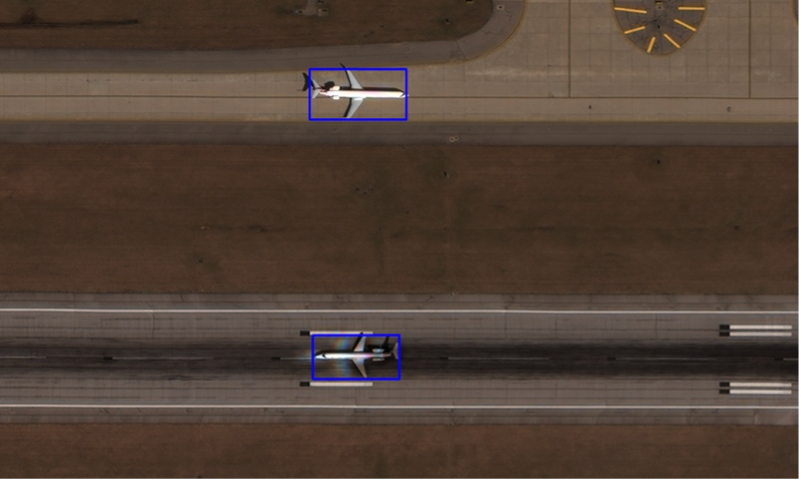
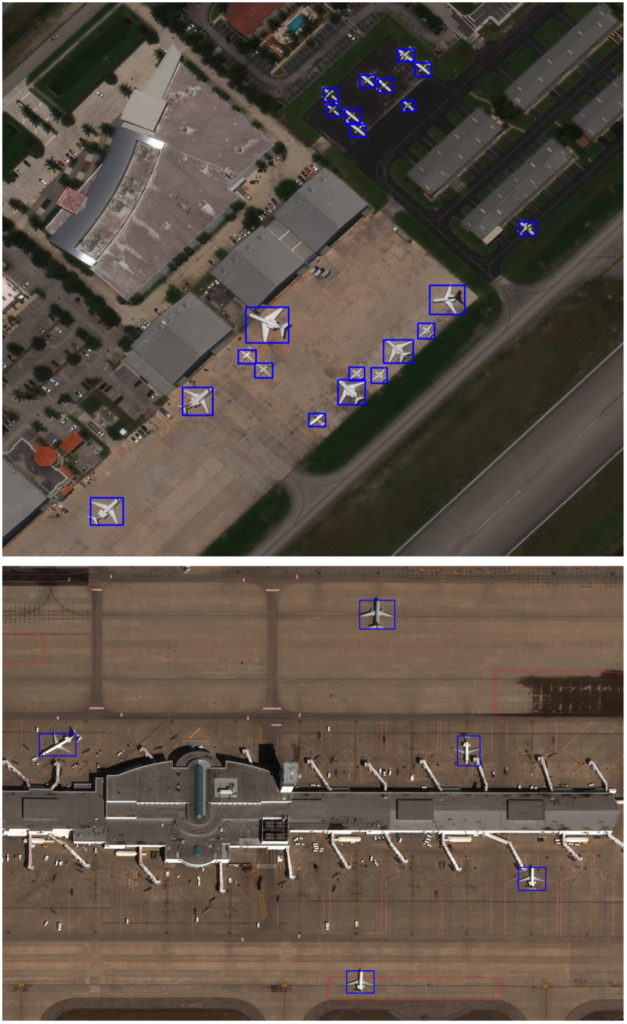
The model is quite adept at detection aircraft (see Figure 6), though identifying the individual aircraft type is far tricker, and the focus of this study.
To detect individual aircraft types, we train a series of 15-class YOLTv4 models using different combinations of real and synthetic data.
Experiment A. Real-only
Experiment B. Real data + synthetic data
Experiment C. Real data + domain adapted synthetic data
Table 1 shows scores for these three experiments. We report the number of training image chips used, as well as mean F1 (mF1) scores, with a detection threshold of IOU ≥ 0.5 to determine a correct detection. In brief, mF1 averages detection scores among all 15 aircraft classes, penalizing both false positives and false negatives. We report 1σ errors computed via bootstrapping.
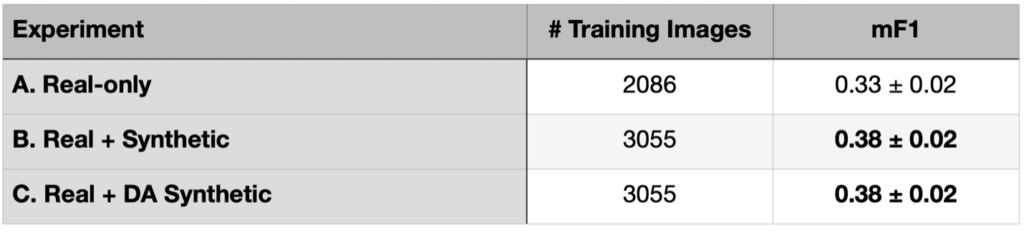
There’s a lot to unpack in Table 1. First, we observe an increase in score from A to B (albeit only 1.8σ) when adding synthetic data. Yet we observe no aggregate increase in score when domain adaptation is applied to the synthetic data (experiment B is equivalent in score to experiment C).
At first blush these results imply that adding synthetic data noticeably improves detection scores for rare objects. Yet, there is a significant caveat. Experiments B and C use more data than our original experiment (A) that used only real data. Therefore it is unclear if we showed that synthetic data improves scores, or if we just showed that more data improves scores. Read on. We attempt to answer this question in the following section.
4. Results Part II: Targeted Augmentation
In Table 1 we showed that adding synthetic data (either domain-adapted or not) improved aggregate detection performance for rare aircraft. In this section we experiment with adding targeted augmentations to the real dataset to observe the effect on performance.
The RarePlanes synthetic data is primarily used to augment objects that occur sparingly in the training dataset. In the previous section, we showed that a naive experiment design shows a boost in performance when adding synthetic data. Yet, what if we could also augment rare objects with real data? In fact, we can.
Since training image chips (416 × 416 pixels) are extracted from the larger satellite images (often 16,000 × 16,000 pixels), we can alter the training chips via custom augmentations including jittering, rotating, and color shifts. While augmentations are standard practice in deep learning pipelines, rotations and jittering are not typically included. See Figure 7.
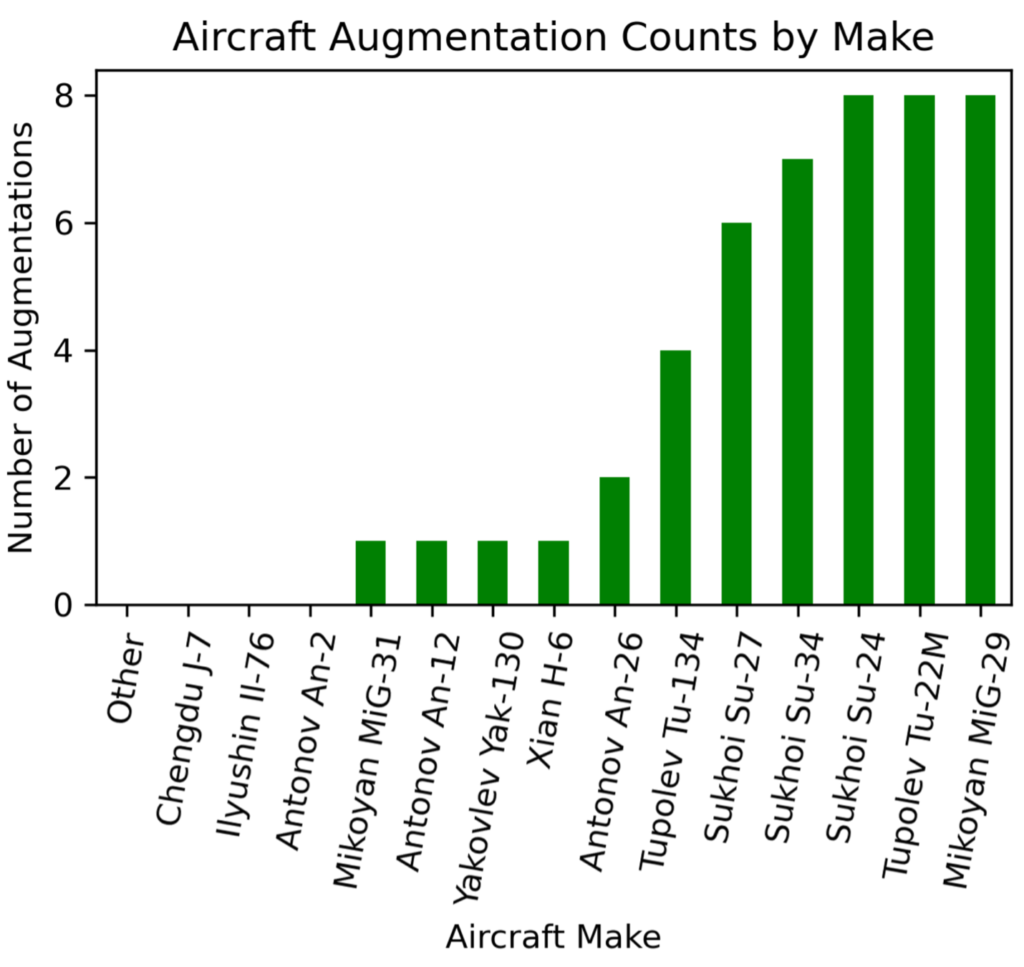
We target augmentations based upon the rarity of objects. Specifically, we extract more training chips for locations centered on the rarest aircraft. Aiming for at least 80 aircraft per class, with a maximum of 8 augmentations per location provides the augmentation strategy of Figure 8.
The original real-only dataset contains 2086 total training image chips, while the synthetic dataset adds 969 image chips. For Experiment D we add the targeted real augmented data (969 image chips) to the original real dataset for the same exact dataset size (3055 total training image chips) as experiments B and C that included synthetic data. We train with the exact same hyperparameters as the previous experiments, and list results in Table 2.
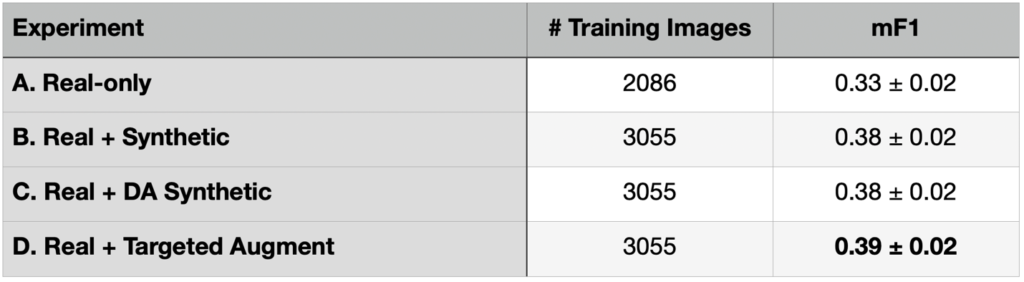
Table 2 demonstrates marginal benefit from strategic manipulation of the existing real dataset (rather than naively adding synthetic data) as a means to smooth out the distribution of object classes. This approach (D. Real + Targeted Augment) requires no new data, and instead relies upon simple (albeit thoughtful) dataset augmentation.
5. Results Part III: Finding the Value in Synthetic Data and Domain Adaptation
So far, we have failed to find any real value in the RarePlanes synthetic data in detecting our 15 aircraft classes. We also experimented with the three-phase training approach (real data → targeted synthetic → targeted real) noted here; though the original work found utility in this three-phase approach, we observe a slight reduction in performance with this approach.
Thus, we conducted one more experiment: adding synthetic data (both native and domain adapted) to our targeted augmented real dataset. This yields a larger training dataset size of 4024 image chips (versus the 3055 image chips of Experiments A, B, C). As before we reserve 1/6 of the dataset for validation during the training phase. As a control (Experiment E) we also increase the number of targeted augmentations such that there are 4024 real training chips for Experiment E. See Table 3 for results.
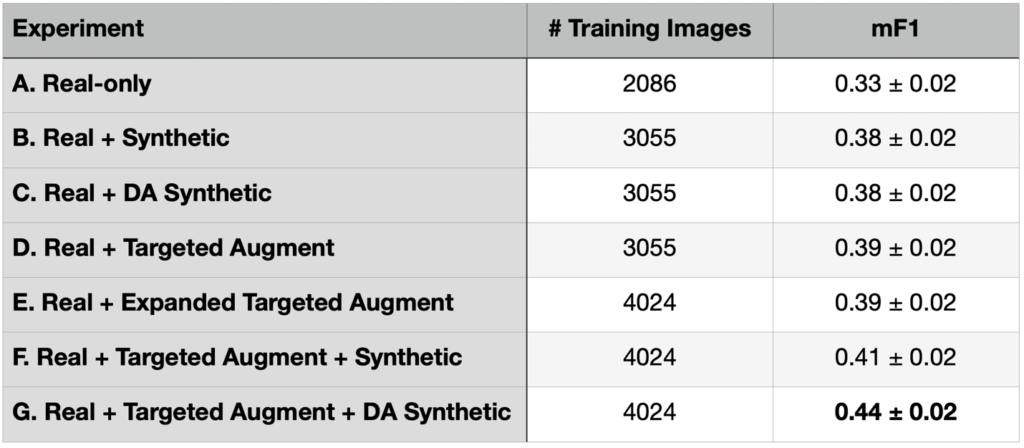
Table 3 indicates that after seven experiments, we finally managed to extract utility from the domain-adapted synthetic data. Experiment G (real data + targeted augmented real data + domain-adapted synthetic data) provides the best performance for rare object detection.
6. Conclusion
Adding synthetic data to real satellite imagery can improve the ability to detect rare objects, with an important caveat: this improvement only manifested when we also implemented a targeted (i.e., non-standard) augmentation strategy with our existing real dataset. Furthermore, domain adaptation (applying a deep learning model to transform make the synthetic data appear more “realistic”) provided a benefit. Clearly, extracting utility from synthetic data can take some effort and creativity.
While the improvement from mF1 = 0.39 ± 0.02 (for the best model trained with real-only data) to mF1 = 0.44 ± 0.02 (for the model trained on both real and domain-adapted synthetic data) is welcome, the improvement is still only ~2σ, not exactly a massive statistical difference, particularly given the number of trials (experiments) involved. Still, if synthetic data is available, our findings show adding domain-adapted synthetic data to a targeted augmentation of the available real data is a relatively easy way to improve performance.
In the final installment of this blog series, we will take a deeper look into results and will show (among other findings) that while synthetic data may not always work well in the aggregate, it does yield interesting results for individual classes.
* Thanks to Nick Weir and Jake Shermeyer for their efforts on experiment and dataset design. Thanks to Felipe Mejia for assistance with domain adaptation training.