

Synthesizing Robustness YOLTv4 Results Part 2: Dataset Size Requirements and Geographic Insights
1. Introduction
The RarePlanes satellite imagery dataset is rich enough to enable copious machine learning and object detection studies, particularly when coupled with attendant synthetic data. In previous posts (1, 2), we discussed the dataset and initial aggregate results for the “Synthesizing Robustness” IQT Labs project, which seeks to determine whether domain adaptation strategies are effective in improving the detection and identification of rare aircraft from the satellite perspective. In this post we discuss detailed results for object detection models, focusing on geographic disparities and individual object classes. We quantify how much harder rare objects are to localize, though this is highly dependent on specific aircraft properties.
2. Aggregate Scores Summary
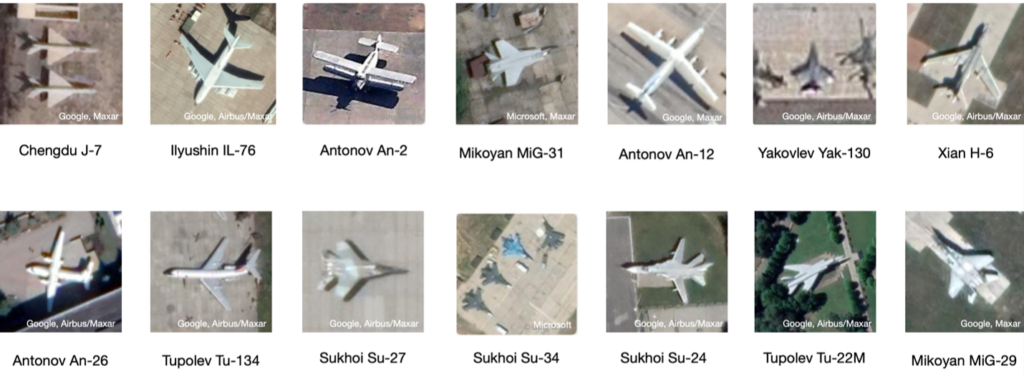
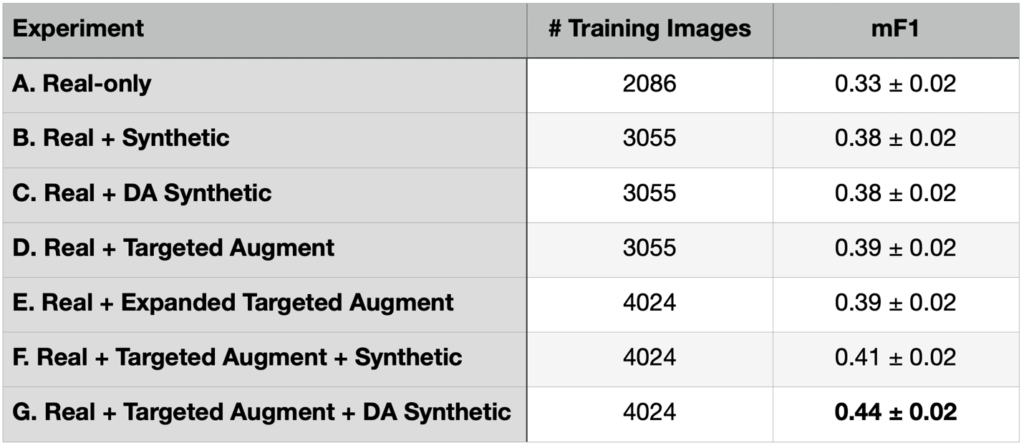
For the Synthesizing Robustness project, we focus on 14 aircraft classes (plus a catchall “Other” category) in both real satellite imagery and synthetic data. These 14 classes include 12 Russian and two Chinese makes. There are originally 99 aircraft classes (from North American T-28 Trojan to Douglas C-47 Skytrain to Chengdu J-20), so the “Other” aircraft class collapses 85 aircraft classes. See Figure 1 for the selected aircraft classes, and our Results Part 1 blog for full details about the dataset. Recall that we ran a series of experiments in the previous blog, eventually finding that combining targeted augmentation of the real data with domain adapted synthetic data (Experiment G) provided the best performance (see Table 1).
3. Geographic Insights – Seen vs Unseen Locales
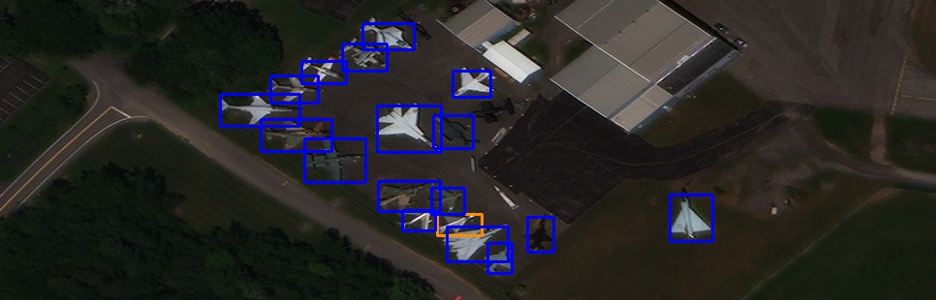
In this section we investigate performance differences in finding and identifying aircraft in seen versus unseen locations. All test images are distinct from the training set, though some test images are taken over the same airport as training images (though on different days).
There are 164 test collects, and 75 unique test locations in our dataset. Each location has multiple observations, and 30 locations (47 total collects) at the same location as the training imagery (though on different days than the training collect). Therefore, 45 locations are unique to the test set, encompassing 117 total collections. In Table 2 we show the performance of the best model (Experiment G: Real + Targeted Augment + DA Synthetic) when broken down by geography.
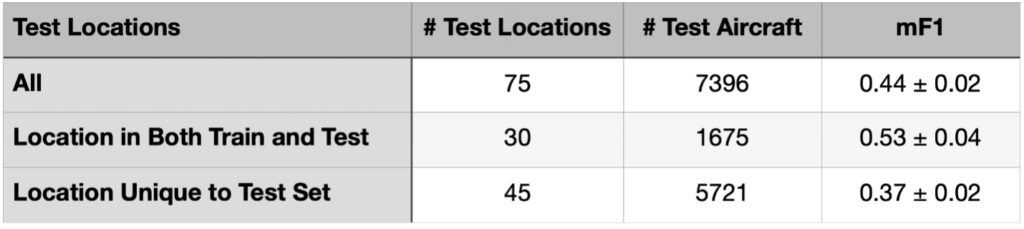
Table 2 indicates that prediction in unseen locales is far inferior to prediction at locations present in the training dataset. While this result may not be qualitatively surprising, quantifying the magnitude of the improvement (43% or 3.5σ) is important for ascertaining the robustness of the model to various deployment scenarios.
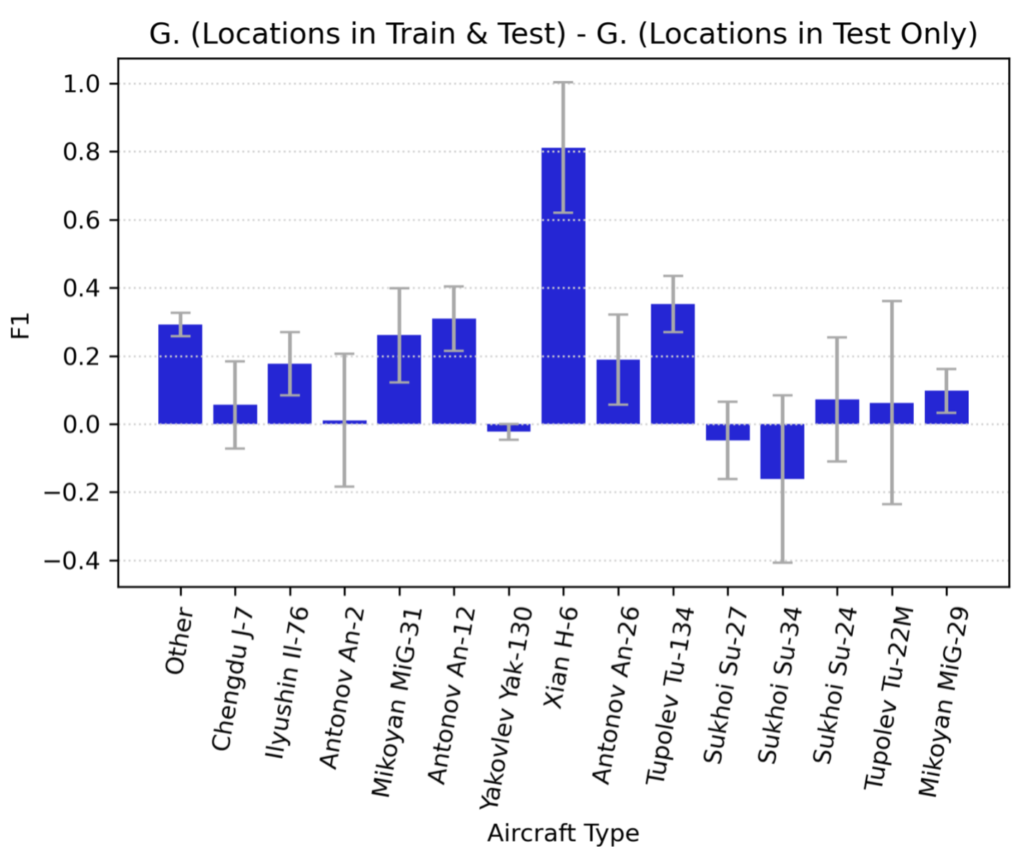
In Figure 2 we show the performance delta for each aircraft class between novel and already-seen locations. For the majority of aircraft classes, performance is only marginally improved if the location has been seen already, though for some aircraft types (e.g., Xian H-6) it is significantly improved.
4. Performance By Training Dataset Size
Much of the rationale for undertaking the original RarePlanes project and the follow-on Synthesizing Robustness project was to study how object detection performance varied according to training dataset size. Results from the initial RarePlanes study are available here, though the Synthesizing Robustness project filters the data differently and will have different results.
In Figures 3 and 4 we show the detection performance for each aircraft class.
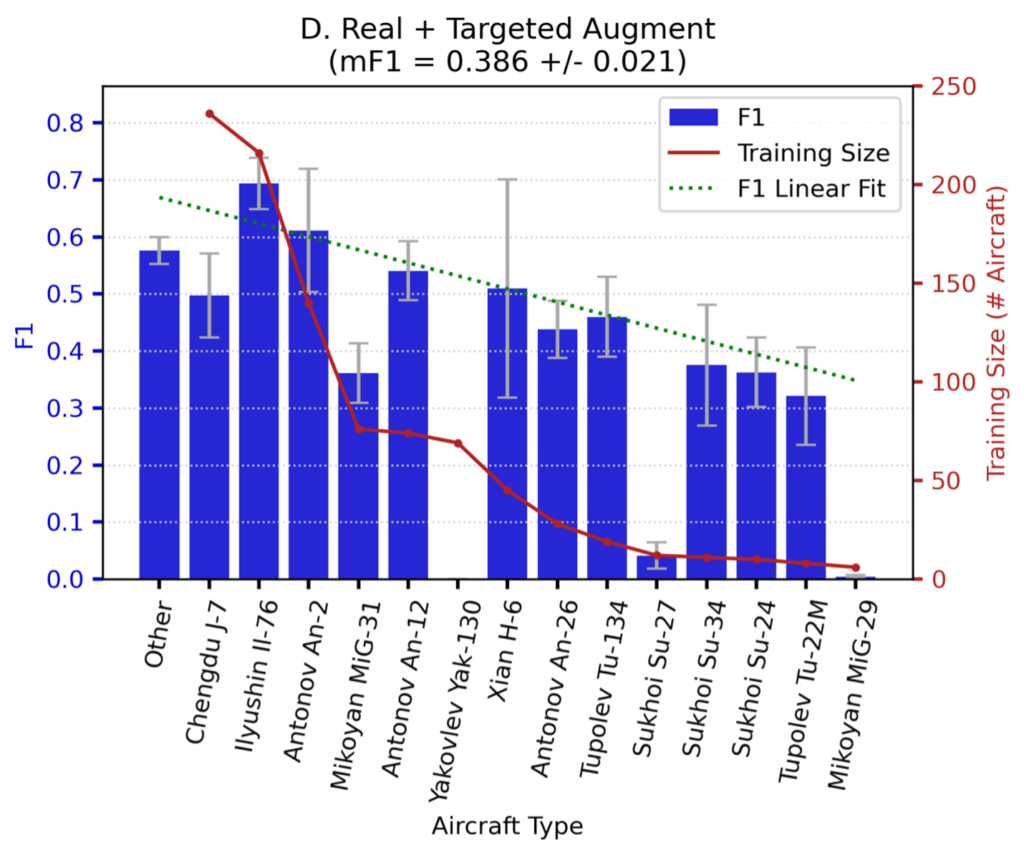
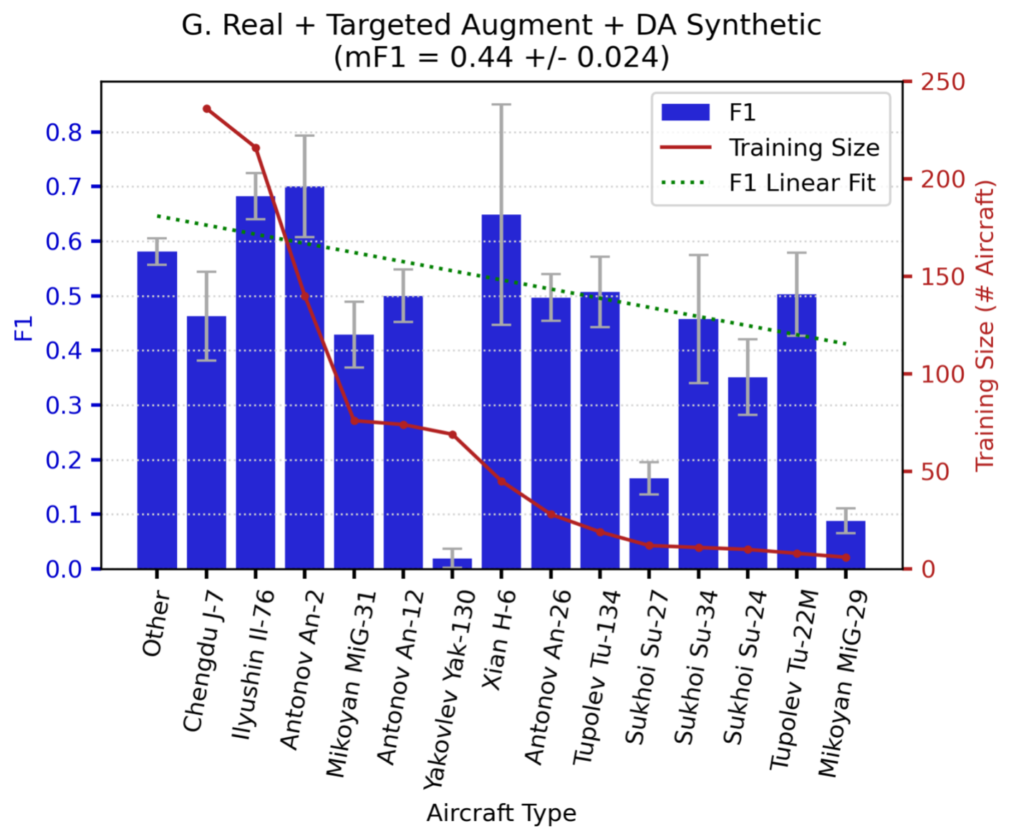
Note that performance for Experiments D and G trends downward with decreasing training dataset size. Also note that the (rather poor) green-dotted linear fit line is both steeper and lower for Experiment D, meaning that adding domain-adapted synthetic data in Experiment G provides greater value for rare objects than common objects. There are a few outliers in the plots (e.g., Yak-130, Su-27) that we discuss in a later section.
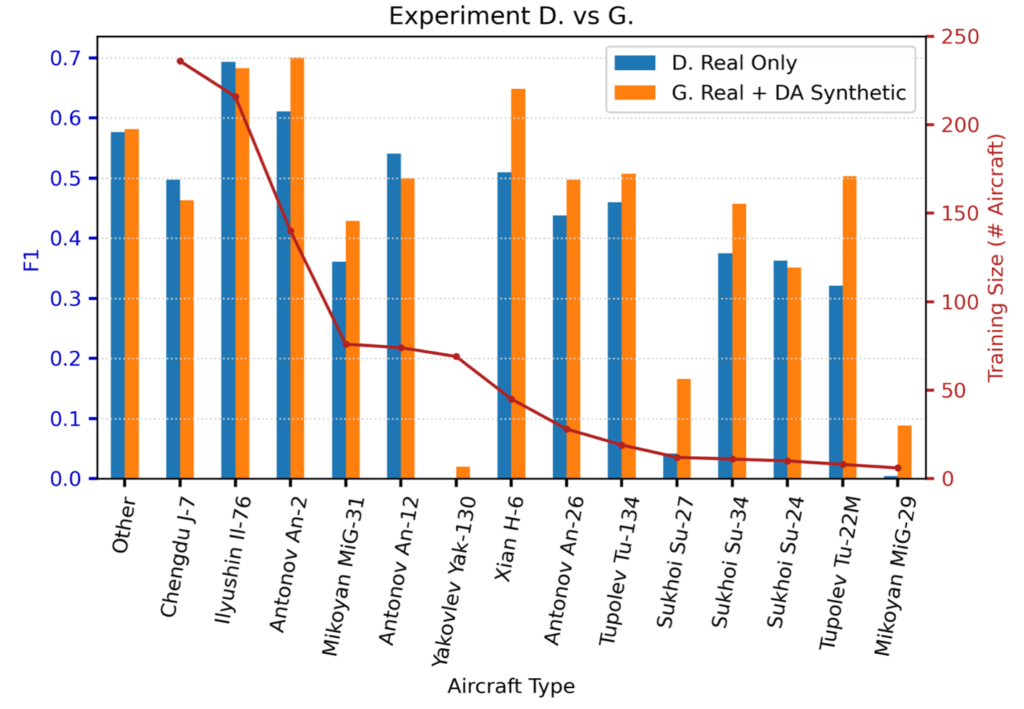
Figure 5 shows the performance difference between Experiment D (real only), and Experiment G (real + DA synthetic). We see that for the most difficult classes (e.g., Yak-130, Su-27, MiG-29) the synthetic data provides a huge improvement. For example, scores for MiG-29 detection increase by over 20× when using the domain-adapted synthetic data.
5. Confusion Matrices
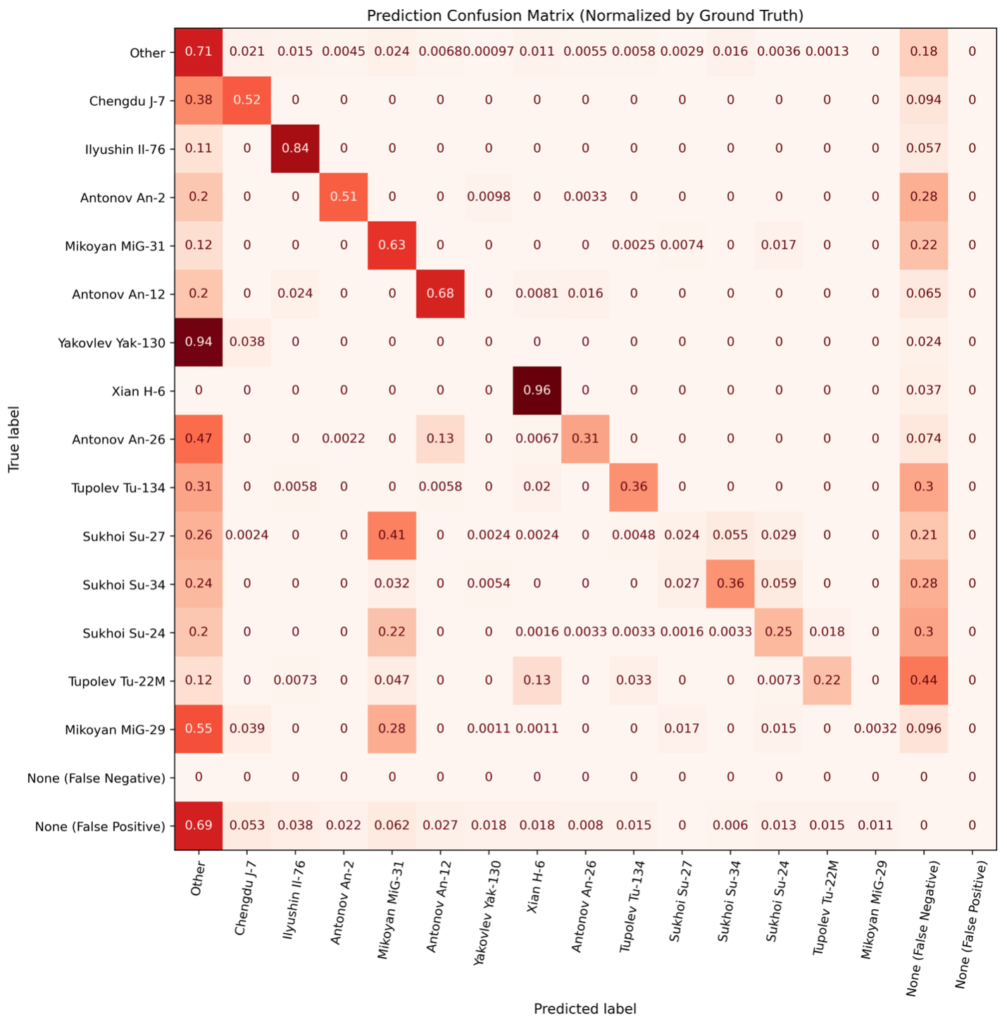
We now dive into specifics of classification errors. In Figures 5 and 6, we compute the confusion matrix between classes. While confusion matrices are often used in simple classification problems, they are less common in object detection scenarios due to the presence of non-classification errors (i.e., false negatives and positives). Accordingly, we compute and plot false negatives and positives in Figures 6 and 7.
Experiment D.
Experiment G.
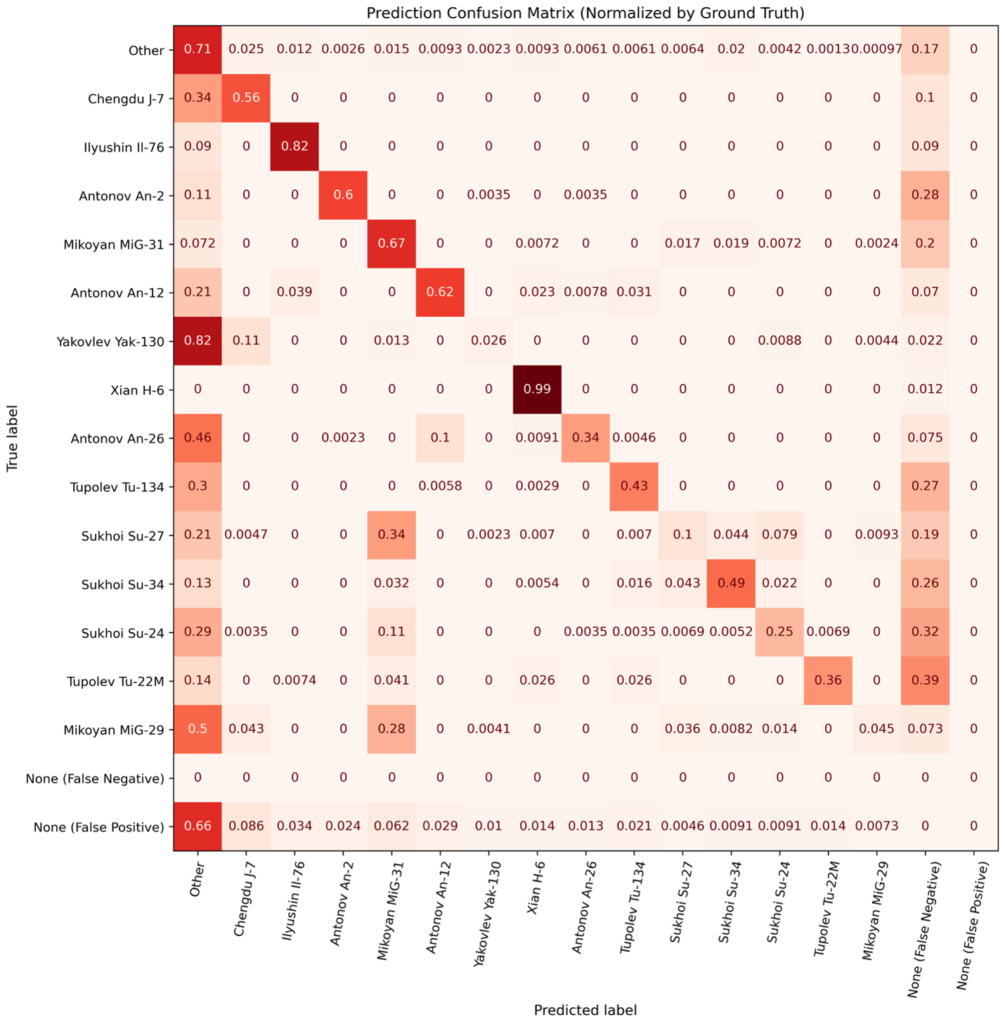
Figures 6 and 7 also illustrate why the scores of certain classes are lower than expected. For example, detection of Su-27s is lower than one might expect (given the trends of Figure 5), but Figure 6 demonstrates that the primary reason for the low detection score is that Su-27s are frequently confused with MiG-31s – another Russian fighter aircraft. Note that for most aircraft makes (particularly the rarest ones), the diagonal in Experiment G is higher than for Experiment D. Note that for most aircraft makes (particularly the rarest ones), the diagonal in Experiment G (Figure 7) is higher than for Experiment D (Figure 6). There are also fewer false negatives and misclassifications as Other in Experiment G. This helps explain the performance boost of the domain-adapted synthetic data used in Experiment G: both overall detections are improved (fewer false negatives), and aircraft makes are identified with higher fidelity (fewer misclassifications).
6. Conclusions
In this post we delved into the specific successes and failures of the YOLTv4 detection model employed in the Synthesizing Robustness project. We showed that predictions in previously seen airfields are significantly higher than predictions for novel, unseen airfields. We also found that domain-adapted synthetic data provides the most value for the rarest classes (see Figure 5), which is consistent with the original findings of the RarePlanes project.
Specifically, the RarePlanes project found greater utility for synthetic data for the rarest object classes. We find that, for this study, domain-adapting the synthetic data provides even more benefit for rare categories. While there is a general trend toward lower performance with fewer training examples, there are significant outliers to this trend. Inspection of the confusion matrix for aircraft classification reveals the degree to which similar aircraft are confused (e.g., Su-27 and MiG-31), and insights into the shortcomings of the model even with domain-adapted synthetic data.
Our research shows that if synthetic data is available, domain-adapting the synthetic data and combining with a targeted augmentation of the real data is a relatively easy way to improve both model performance and the utility of the synthetic data. Synthetic data certainly is not a panacea, and certain classes of objects may see little to no improvement with synthetic data. In summary, after multiple experiments we can conclude that extracting utility from synthetic data often takes significant effort and creativity.
This post concludes our Synthesizing Robustness project. We encourage interested readers to delve into the previous blogs in this series (1, 2), the original RarePlanes project, or reach out to us with questions.
* Thanks to Nick Weir and Jake Shermeyer for their efforts on experiment and dataset design. Thanks to Felipe Mejia for assistance with domain adaptation training.