

3D Imaging 101: Tips, Tricks, & Resources – A Primer for Digitizing the World
3D data is on the rise. The last several years have seen an exponential growth in the collection of 3D data from sensors and the use of 3D data in a myriad of workflows. Where once 3D data referred to simply computer-aided design (CAD), typically built for information modelling (BIM) in architecture or engineering — or 3D world creation for video games — now a broader use of cheaper, miniaturized, easier-to-use sensors and related software are opening the 3D floodgates for 3D data to be the digital scaffold of a more thoroughly mapped physical world. From replicating objects with 3D printing, to populating virtual and augmented reality realms, 3D data is the geospatial backbone of spatial computing and the Metaverse and ARCloud to come. It’s the framework upon which today’s digital twins are being built in smart cities, for smart buildings, and more. We will have a 1:1 living digital copy of the Earth and be able to use the Digital Earth for extraordinary things, the likes of which we can only glimpse today.
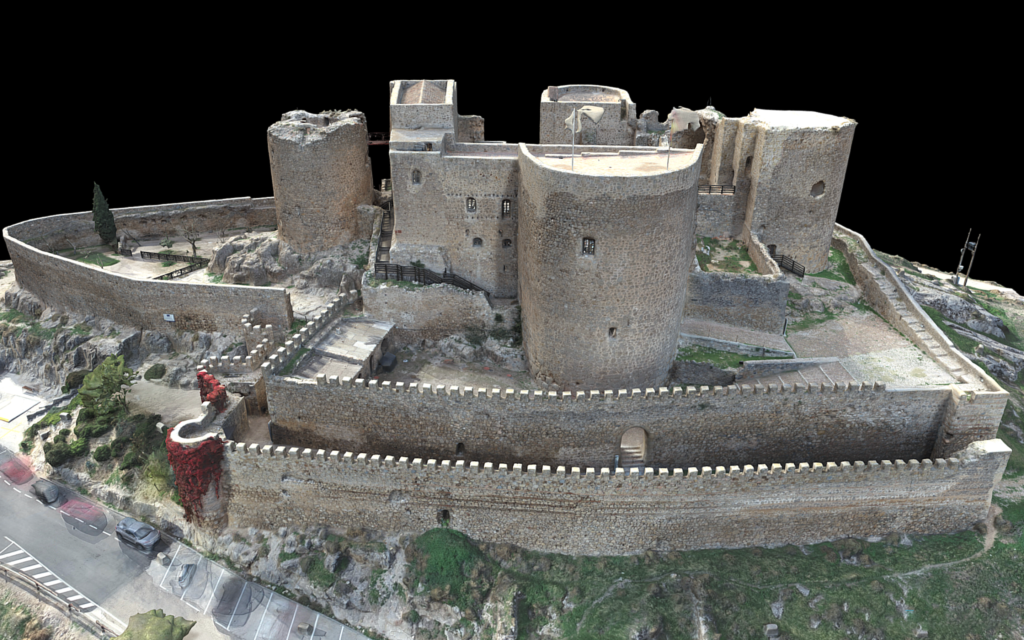
A plethora of amazing startups and bigwigs have put forth photogrammetry and terrestrial laser scanning apps of varying recipes to build the baseline 3D scaffold of a Digital Earth—thereby commercializing systems that were expensive and used primarily in industrial and niche cases for years. As more people conduct ubiquitous and even casual 3D data capture, we wanted to offer some best practice resources for learning more about each technique and its purpose, how to best utilize it, and how it’s been used historically. (Spoiler alert: often they have been used to document history. Digital heritage and tourism are big business. Creating a 3D record of the world’s historical monuments has set the trajectory of 3D capture we are seeing today).
Therefore, this blog post offers a quick guide to the close-range forms of 3D imaging that are being rapidly commercialized (i.e., photogrammetry and terrestrial laser scanning aka LiDAR), as well as structured light scanning and reflectance transformation imaging which we believe are the next two arenas of 3D imaging that we reckon will be commercialized further in coming years. At the end, we briefly explore a few thoughts on multispectral imaging modalities.
Resources for Close Range 3D Imaging In General:
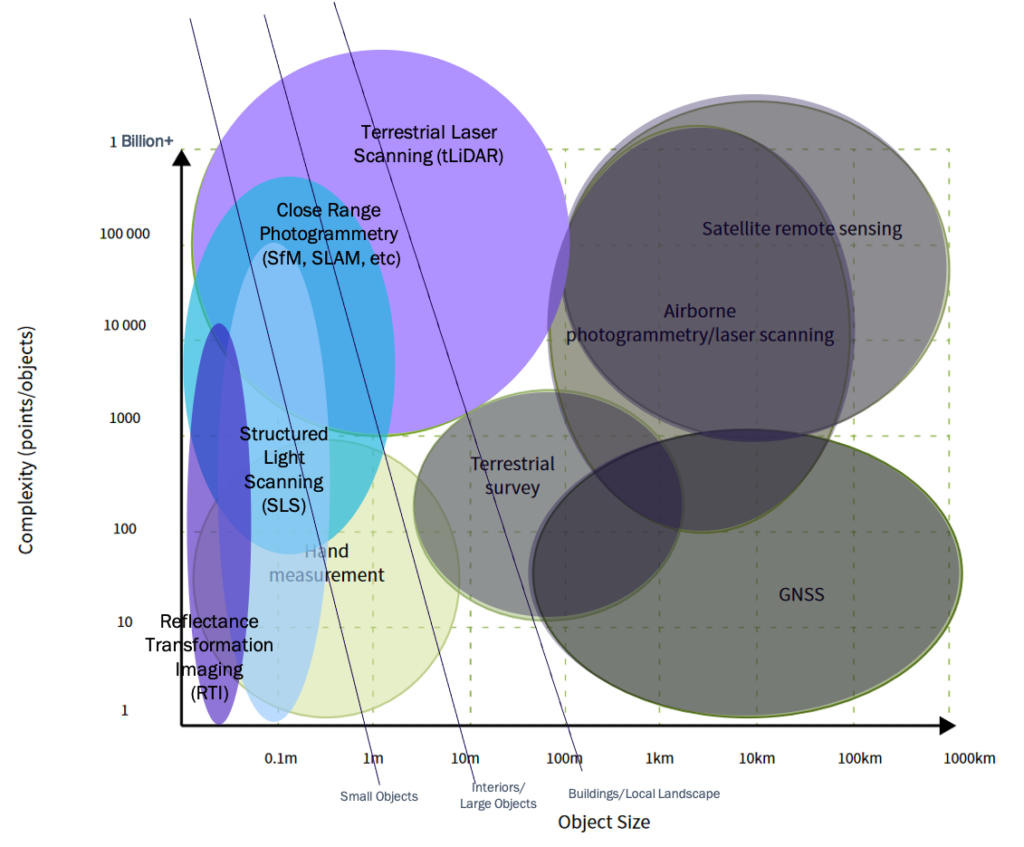
3D imaging is most easily divided by the size of the object being imaged by a sensor and how closely it can be imaged for high resolution detail (complexity or ‘points possible per object’).
Close-range imaging deals with smaller objects and are captured by a sensor close up.
Far-range represents the more traditional remote sensing arena of aerial imagery collected from a sensor farther away (i.e., via a plane or satellite).
Terrestrial survey in Figure 1 encompasses a middle zone between the two and is intended to loosely umbrella those forms of capture that are neither fully terrestrial or aerial (i.e., 3D capture via drone) or encompassing single-point 3D spatial data collection via traditional geospatial information systems (GIS).
This post focuses on the close-range section, but bear in mind that to fully digitize the physical world and all landscapes, buildings, people, and objects therein—systems that pull together multiple imaging modalities at multiple scales with other data arenas (asset management, activity-based intelligence systems, etc.) to build a granular, scalable, updatable simulacra of everything—will win the race to build an interactive, analytical and re-visualizable digital earth.
We’re diving down into the specifics of four different types of close-range 3D imaging herein. If you’re new to 3D imaging writ large and hoping to start broader, here are a few baseline resources to learn more about the wider world of close-range 3D imaging:
• #MustRead —3D Laser Scanning for Heritage: Advice & Guidance on the Use of Laser Scanning in Archaeology & Architecture, English Heritage
• #MustRead —Photogrammetric Applications for Cultural Heritage: Guidance for Good Practice, English Heritage
• 3D Scanning — Quick Guide (Factum Arte)
• What is 3D Data? — SPAR Point Group
• 3D Scanning Methodology Comparison — Factum Foundation (includes best breakdown of resolution/range/feature comparisons of scanning types)
• How to Choose Which Type of 3D Scanning — Artec
• Remote Sensing & the Digital Scaffold — (a similar guide from yours truly)
• For Objects — Handbook of Best Practice & Standards for 2D & 3D Imaging of Natural History Collections, European Journal of Taxonomy
• For Building Interiors — A Review of Techniques for 3D Reconstruction of Indoor Environments, International Journal of Geo-Information
• Quick TLDR Guide from Vuforia, (inc placement suggestion maps)
If you’re keen to see 3D data from this type of imaging in action or want to pull a sample of 3D data to play with and learn from, here are a few potential test data sources:
Creative Commons/Store Archives
• Best list of International Federal Archives — yep, the best version of this is a blog from an Eastern European surveyor and we should all work to build a bigger, more central live mechanism to collate this data for reference
• Sketchfab — suggestions include British Museum Collection, and Heritage Drone Providers like Archeomatique or Topographers
• Thingiverse — especially if testing 3D Printing workflows
Structure from Motion Close-Range Photogrammetry
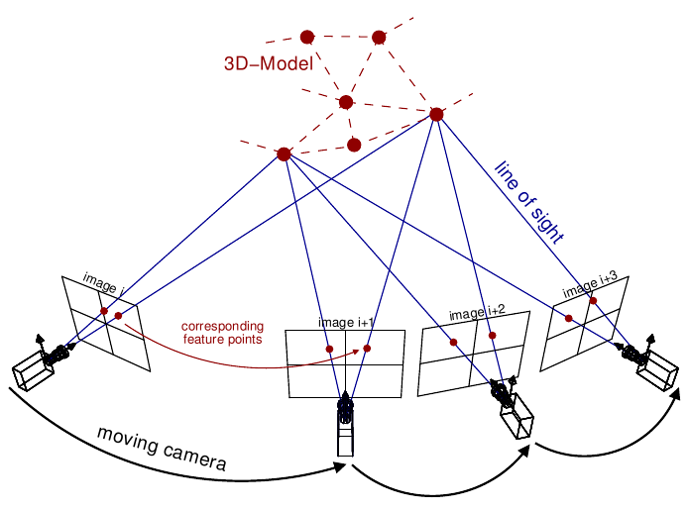
Photogrammetry is the type of 3D capture becoming available in more and more applications from a wide range of companies—from geospatial and mixed reality to the automotive industry. Photogrammetry itself is an umbrella term for multiple flavors of 3D imaging, all of which utilize overlapping photographs to mathematically build a 3D model of the scene that was captured. Structure from Motion (SfM) is the most straightforward of these, and it utilizes corresponding features in photographs to build a 3D Model (See Figure 3). If Structure from Motion were a tiny animated plumber named Mario and it was to run into a 1-up mushroom—it becomes simultaneous localization and mapping (or SLAM). In other words, SLAM is SfM evolved via power-up.
In addition to SfM’s use of corresponding features in photographs, SLAM utilizes additional information from the sensor device (i.e., camera, phone, etc.) to calculate the collection point for each sensor and use that piece of data to strengthen the math and therefore the resulting 3D model. Unfortunately, while this should mean that the 3D model is tighter and has higher-resolution, more often than not this means commercial software enables other parts of the equation to be a bit lazier. The result? A faster 3D capture of an object or place, but no greater clarity of the 3D mesh generated from photogrammetry.
Currently, phone-enabled portability is spreading the use of photogrammetry within a myriad of apps for gaming, social media, home rentals and real estate, furniture placement, and more rolling out from tech companies and the retailers themselves.
If you’re interested in learning more about photogrammetry, here are a few additional resources:
• A Journalist’s Guide to Photogrammetry
• #MustRead — Photogrammetric Applications for Cultural Heritage: Guidance for Good Practice, English Heritage
• Getting Started with Photogrammetry (raw processing) from smartphone camera
• Photogrammetry rom scratch using older “non-smart” photos
• Best Practices Resource Hub for Indoor Imaging — using SfM Apps/Devices, Matterport
Best Software:
• Pix4D
• Autodesk Remake — FKA Remake, 123D Catch
• For general 3D editing — MeshLab
• For rapid cleaning for 3D printing — Autodesk MeshMixer
• Additional Guide with further Software Comparison
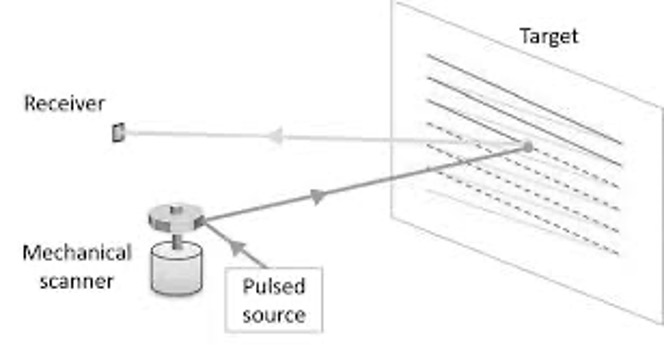
Terrestrial LiDAR (tLiDAR)
Terrestrial laser scanning, also known as terrestrial LiDAR (or light detecting and ranging), is the use of a pulsing laser pinging light into a space. The scanner calculates how long each ping takes (official term: time of flight or ToF) and charts each point as part of a cloud of points or ‘point cloud’ that represents the physical space as a digital replica. Where photogrammetry often creates far more photo-realistic scenes, terrestrial LiDAR collects more geometrically accurate ones. Ideally and with most tLiDAR systems, the two are used in tandem to create a composite of the modalities that can be toggled on and off as required for the desired end goal.
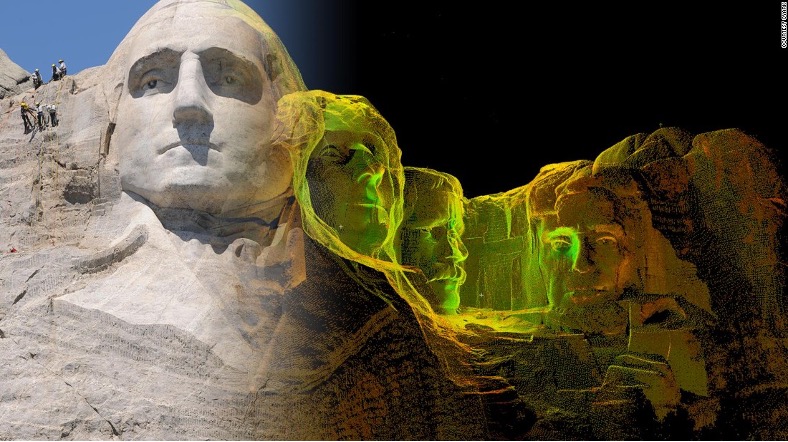

Historically, the sheer size of point clouds kept them in high-end industrial software. Over the last decade, game engines have raced ahead on how many points they can handle in their systems, and have eliminated the sizable technical barrier that once kept point clouds and LiDAR out of the 3D mainstream.
Previously tLiDAR was commonly used in the Architecture, Engineering, and Construction (AEC) industries, for Industrial Surveying (of industrial plants and mines), and for digital heritage. More recently it’s been seen as a component of the imaging systems required for autonomous vehicles to move and on other moving gadgets—from drones to robots. It’s also popped up as miniaturized low-res LiDAR in phones, especially for mixed reality. Apple’s built in tLiDAR is still on the low resolution end of what’s possible, but has pushed phone manufacturers into a race for better built-in 3D capture to our everyday devices.
Keen to learn more about the glory that is terrestrial LiDAR? Here are some additional resources:
• #MustRead — 3D Laser Scanning for Heritage: Advice & Guidance on the Use of Laser Scanning in Archaeology & Architecture, English Heritage (includes scanner/software breakdown/comparison)
• Scan To BIM Workflow — with fab architecture of flow from point to polys, Uni of Lisbon
• Industrial Plant Imaging Workflow, Fraunhofer
• Guide to Good Practice for Laser Scanning Portal, UK Archaeology Data Service
• Faro Laser Scanning Best Practice — specific to Faro Focus & Scene software, but provides wider methodology reusable for other proprietary tLiDAR systems
• Decent tLiDAR Buyers Guide Scanner Comparisons/Specs/Cost, ANIWAA
• Leica’s Laser Scanning Webinar Archives — Leica is the foundational tLiDAR group and has the biggest, most trusted corpus of education material/experience with teaching imaging surveying in relation to their proprietary soft/hardware and as general methodology
• Best Collection Tool — LeicaBLK360, Faro Focus Line
Best Software:
Proprietary:
Open-Source Pieces:
• PDAL-Point Data Abstraction Library
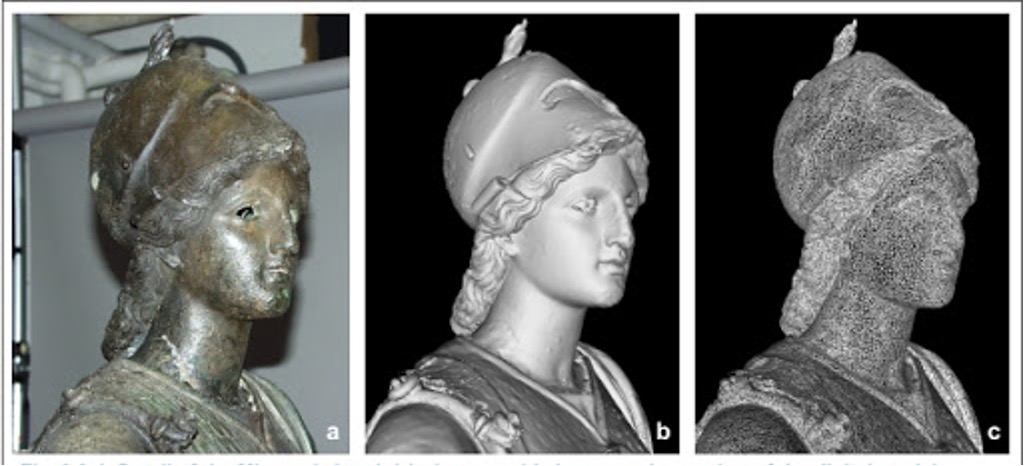
Structured Light Scanning (SLS)
Structured Light Scanning (SLS) was initially the type of 3D imaging poised for mass commercialization. It works by building textured meshes via a patterned light projector as illustrated below:
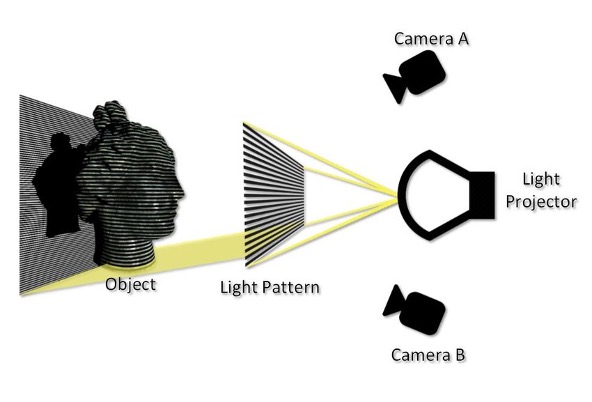
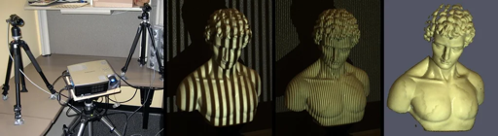
SLS is relatively popular, available in products like Microsoft Kinects. But, it didn’t catch on as quickly or become as popular as structure from motion style photogrammetry. SLS has limitations in both what and how it captures 3D location and movement. Consumer commercial versions of SLS have also focused on rapid capture, which results in a 3D model that looks melty around the edges. BUT at the high-resolution end of SLS, there is much beauty and resolution to be found—IF you are a stationary object of the right size and captured the right way. When eBay and Amazon begin using 3D and include 3D copies of their wares for users to spin around and investigate, SfM will duke it out with SLS to see which form of photogrammetry works best for users in this context. Similarly, direct-to-home 3D printing will have to make a similar decision, i.e., if everyone has a 3D printer and you don’t buy things in the mail, you print them at home—high res SLS may win out over SfM for building better printable 3D models.
Meanwhile, there’s another variant of SLS already trending up, the base for AR Light Projection Mapping. So when you’re seeing lovely light displays projected onto buildings (like the Sydney Opera House during the annual Vivid Festival or the Smithsonian Air & Space Museum’s Apollo 11 projection on the Washington Monument), or any of the incoming home and gaming based versions of interactive augmented reality via projectors, that’s likely using SLS to map the wall and then remap the desired graphical content back onto it.
For more on SLS, here are some additional resources:
• SLS: What Is It? How Does It Work (3D Insider)
• SLS Artec Workflow (Stetson University)
• High Res Small/Industrial Object SLS for 3D printing quality replication best practice (UK Natl Physical Lab)
• How DO SLS Scanners Work/Workflow Video (Polyga)
Best Collection Tools/Software:
• Artec line of scanners & proprietary software
• HP 3D Scan (formerly the DAVID scanner) & proprietary software
Reflectance Transformation Imaging
Reflectance Transformation Imaging (RTI) is another form of photogrammetry applied to niche uses in digital heritage, forensic science, geology, etc. But if 3D imaging wants the most granular visual level (and if the amount of industry requests I get about it are any indication, it does), RTI will eventually play a stronger role in the integrated 3D mapping stack.
Formerly (though occasionally still) referred to as Polynomial Texture Mapping, Reflectance Transformation Imaging builds a high-resolution interactive mesh model by recording a visible and trackable light source moving across its SfM collection. It is, essentially, multiple SfM models all rolled into one — with different lighting present so that you can scroll through different light shaders — allowing you to see supra-high-resolution detail that the shadows and obliques of the light reveal from different angles.
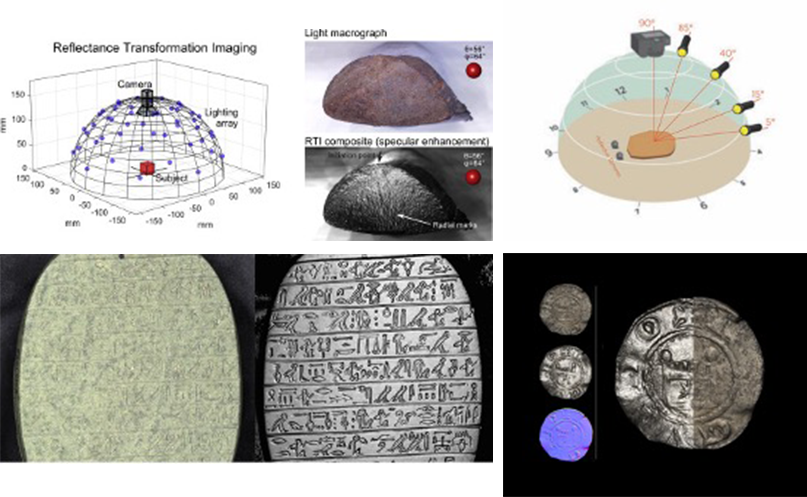
In its niche use, it is typically used as a post-evaluation tool. It can help literally shine light on why a piece of machinery or piece of infrastructure failed and thus finds itself used in material and industrial science as well as part of the structural engineering toolkit. In the digital heritage arena, it is used in art diagnostics to evaluate whether artwork is real or a forgery, and in archaeology to digitize difficult to read objects to provide clarity for the translation of ancient artwork, coins, and structures. For all its niche-yness, there’s one place nearly everyone has seen it—in forensic science for the analysis of bullets and tool marks (yep—those include flavors of RTI). In all of these cases, it is typically used after something has gone wrong. However, RTI may play an important role to come in future diagnostic engineering — because wouldn’t it be great if we could check all of our aircraft and spacecraft regularly-super quickly, en masse for any stress fractures or wonky pairings imperceptible to the human eye under normal conditions? It really, really would.
Whether you want to learn more about RTI specifically or just really want to watch some lovely hypnotic YouTube videos of cool science in action—here are some resources that will get you there:
Best Practice Resources/Use Cases include:
• RTI Primer from Cultural Heritage Imaging (CHI)
• RTI Intro Video + Use Cases, Ignite
Best Collection Tools/Software:
• Collection can be easily rigged with a moveable light source and a black marble with a paper target
• Processing is more often in open source, plugged into SfM software, or more often-collection/processing is done in a lab environment by specialist groups
• RTI Viewer (Opensource)
A Quick Note on Multispectral Modalities
Visible light is not, however, the only aspect of the electromagnetic spectrum that can provide value to 2D and 3D mapping. It just happens to be the part of the electromagnetic spectrum that humans can see. Thus, we prioritize it. There’s a wide array of multispectral tools that humanity has concocted to make up for our biological handicap so that we can “see” even more about the world we thought we were “seeing” around us.
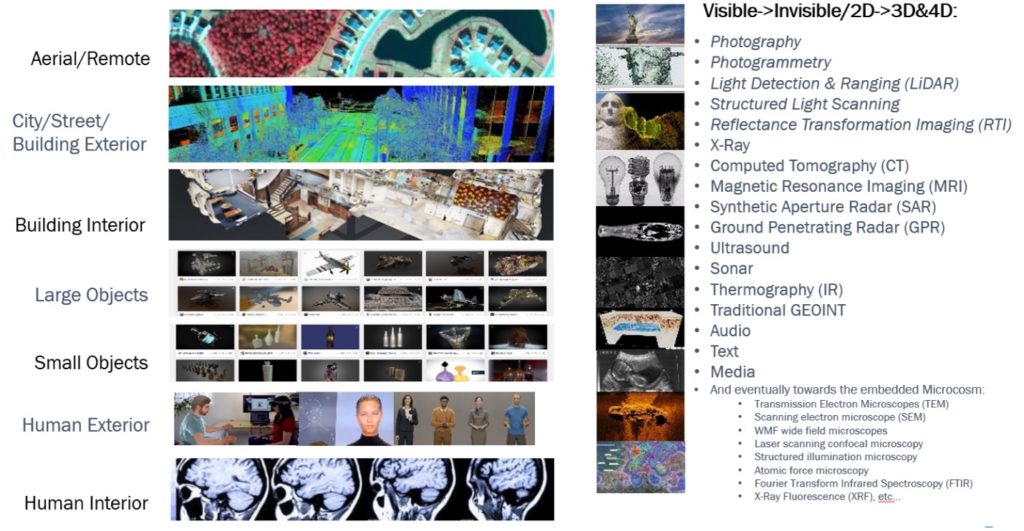
As 3D imaging and 3D models become part of our everyday products and practices, it is worth bearing in mind that this is only the beginning of the digital scaffold humanity we will be able to create in order to document, analyze, and augment the world around us. While most of the systems mentioned in the below graphic are currently used in niche places (like medicine or surveying)—for us to fully digitize our world and or explore other ones (#StarTrekTriCorder)—these other modalities of diagnostic engineering and media hinted at in the final figure here will need to be commercialized and integrated further into the grand spatial computing mapping stack. And with that mapping stack, we will be able to move forward on building a holistic Digital Earth—capable of unlocking everything from supply chain optimization, smart cities, and the metaverse.