

Preface: SpaceNet LLC is a nonprofit organization dedicated to accelerating open source, artificial intelligence applied research for geospatial applications, specifically foundational mapping (i.e., building footprint & road network detection). SpaceNet is run in collaboration by co-founder and managing partner CosmiQ Works, co-founder and co-chair Maxar Technologies, and our partners including Amazon Web Services (AWS), Capella Space, Topcoder, IEEE GRSS, the National Geospatial-Intelligence Agency and Planet.
In this post we dive into some of the building-level metrics for the SpaceNet 7 Multi-temporal Urban Development Challenge. We compare results to past SpaceNet challenges and note that despite the challenges of identifying small buildings in moderate resolution (4m) imagery, the pixels of SpaceNet 7 seem to overachieve when compared to SpaceNets past. A follow-up post will dive deeper into the temporal change and tracking lessons from this challenge.
1. Performonce vs IOU
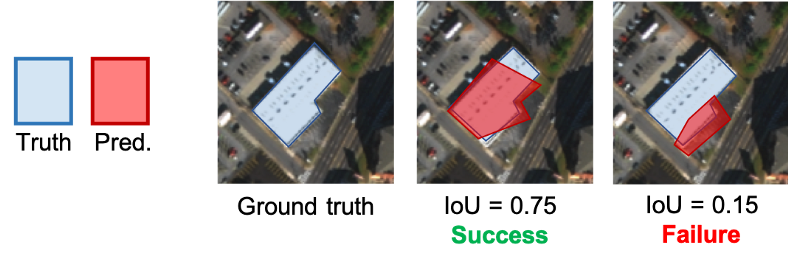
For all five of the SpaceNet challenges focused on buildings (SpaceNets 3 and 5 explored road networks), we used an intersection over union (IoU) metric as the basis for SpaceNet scoring. This metric was illustrated in one of our SpaceNet 4 analysis blogs, see Figure 1.
An IoU of 0.5 or greater is typically used to determine success, and this threshold was adopted in previous SpaceNet challenges. Figure 2A illustrates performance for the winning SpaceNet 7 algorithm, scored over all 41 areas of interest (AOIs) in the public and private test sets. This test set contains over 4.4 million building footprints. For small objects the IoU is often reduced. Given the small size (in pixels) of buildings in the moderate (4.0m) resolution SpaceNet 7 dataset, for the SpaceNet 7 challenge we adopted a lower threshold of IoU ≥ 0.25 to mimic Equation 5 of ImageNet (see Figure 2B).
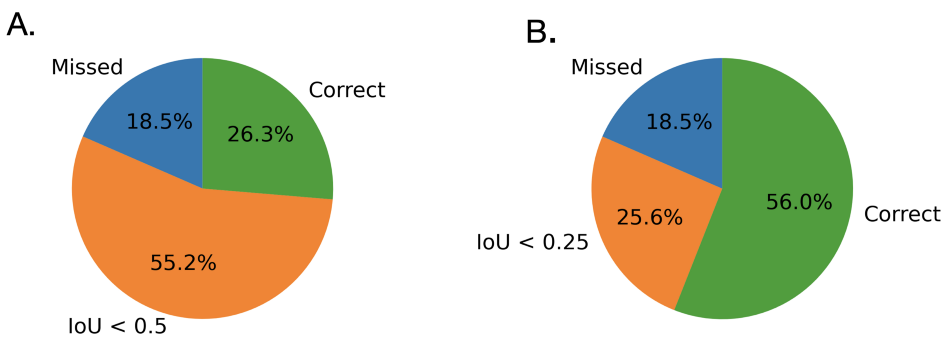
Figure 2 illustrates that the recall rate more than doubles if one drops the IOU threshold from 0.5 to 0.25. Analysis of the higher resolution (0.5m) imagery in SpaceNet 4 showed that the recall increased by only 15% when the IoU threshold was dropped to 0.25 from 0.5 (see Figure 2 here). Unsurprisingly, the moderate resolution imagery of SpaceNet 7 makes precise footprint prediction difficult, with a large fraction (~30%) of buildings having an 0.5 ≥ IoU ≥ 0.25.
2. Performance vs Building Area
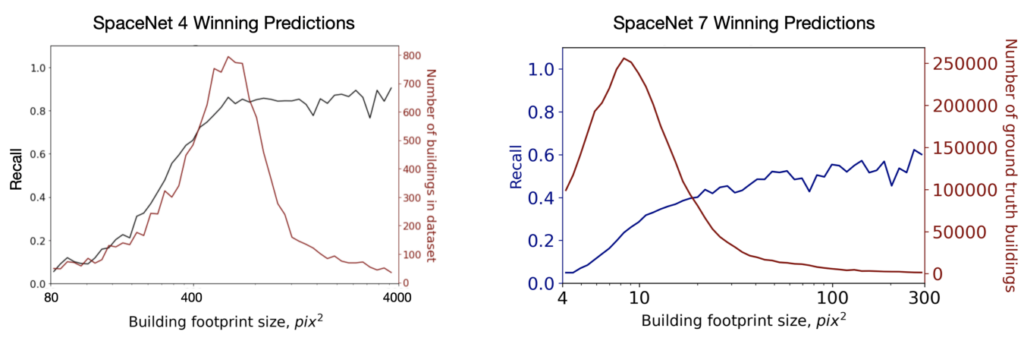
Object size is an important predictor of detection performance, as noted in a number of previous investigations (e.g. [1, 2]). We follow the lead of analyses first performed in SpaceNet 4 (and later SpaceNet 6) in exploring object detection performance as function of building area. Figure 3 shows performance for all 4.4 million building footprints in the SpaceNet 7 public and private test sets for the winning submission of team lxastro0.
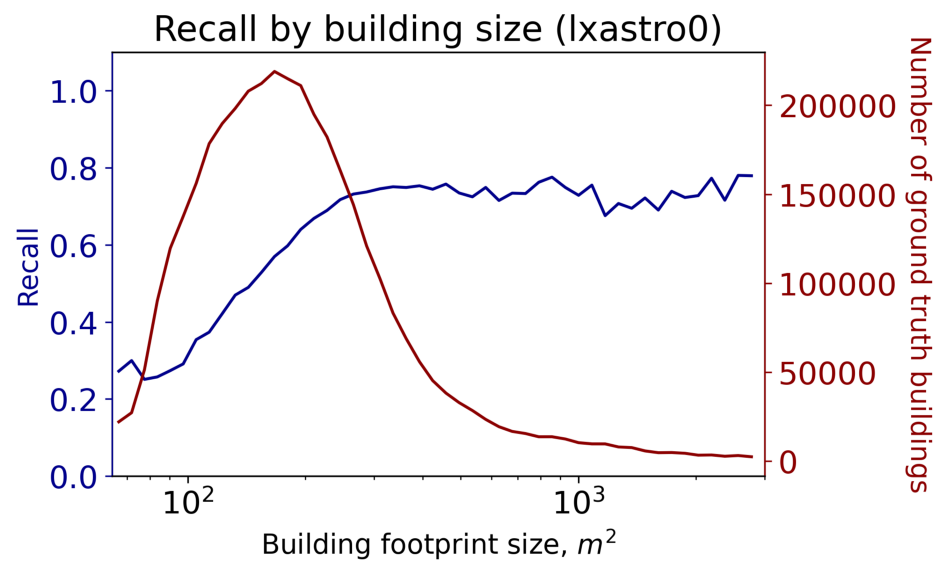
Figure 3 illustrates that building recall improves until an area of ~300 square meters, though the building area histogram peaks at ~160 square meters and then declines precipitously.
In Figure 4 below, we compare SpaceNet 7 performance to SpaceNets 4 and 6, both of which boasted a 0.5m resolution as opposed to the 4.0m resolution of SpaceNet 7. Here we use IoU ≥ 0.5 to directly compare the three challenges.
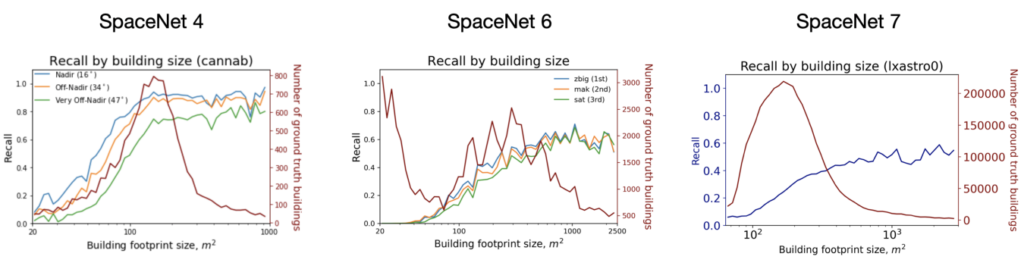
The building area histograms look similar in Figure 4 for SpaceNets 4 and 7, yet the performance curves are very different; SpaceNet 4 performance asymptotes at ~120 m², whereas SpaceNet 7 asymptotes at ~1000 m² with much lower recall. Of course the pixel areas are different by a factor of 64 (4m / 0.5)², so a 120 m² SpaceNet 4 building is a ~20 ⨉ 20 pixel square, whereas an 1000 m² SpaceNet 7 building occupies only a ~8 ⨉ 8 pixel square. So SpaceNet 7 predictions are actually superior to SpaceNets 4 and 6 when comparing comparable building pixel areas: a ~8 ⨉ 8 pixel square in SpaceNet 4 yields a recall of ~0.1, whereas in SpaceNet 7 the recall is ~0.55.
Figure 5 plots pixel sizes directly, demonstrating the far superior pixel-wise performance of SpaceNet 7 predictions in the small-area regime (~5⨉ greater for 100 pix² objects), though SpaceNet 4 predictions have a far higher score ceiling.
3. “Omniscient” Labels
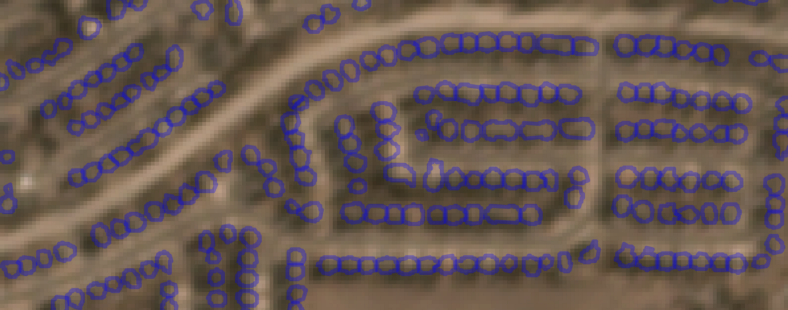
The labeling process for SpaceNet 7 was an exhaustive 7-month effort that leveraged both the native Planet 4m resolution imagery, as well as higher-resolution imagery in particularly difficult scenes. By leveraging complementary data sources, the labelers were able to create what we have dubbed “omniscient” labels that appear to be far higher quality than the imagery merits. Figure 6 provides an illustration of a dense SpaceNet 7 region.
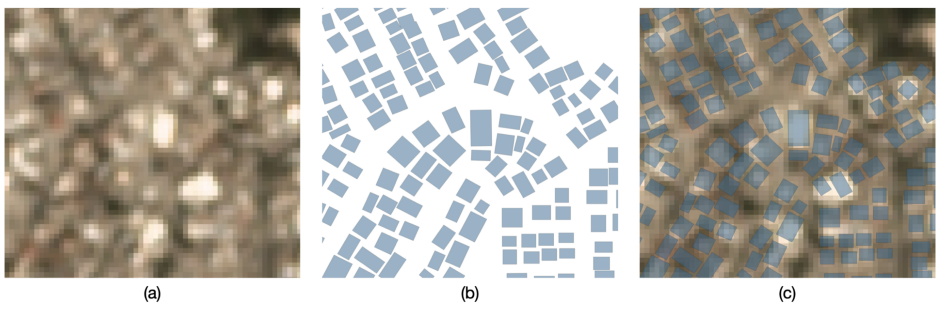
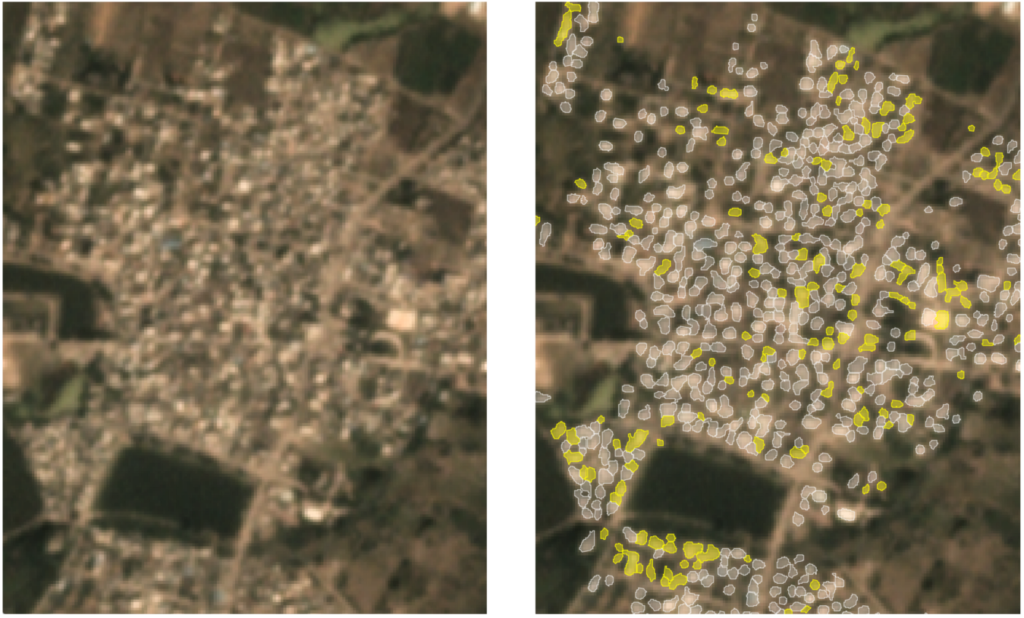
Figure 6 shows that label precision exceeds what the human eye could easily distinguish in 4m resolution imagery. This high label fidelity helps explain the overachievement of the winning model prediction on small buildings. The labels encode extra information not present in the imagery, which models are able to leverage. Of course there is a limit (hence the score ceiling of SpaceNet 7 predictions), but this extra information does appear to help models achieve surprisingly good performance on difficult, crowded scenes, as in Figure 7.
In this post we showed that predictions for the SpaceNet 7 4m resolution dataset perform admirably for very small buildings. In fact, Figure 5 showed that prediction performance for 100 pix² objects is ~5⨉ for SpaceNet 7 than for SpaceNet 4. The high fidelity “omniscient” labels of SpaceNet 7 seem to aid models for very small objects, though the lower resolution of SpaceNet 7 results in a lower performance ceiling for larger objects. Insights such as these have the potential to help optimize collection and labeling strategies for various tasks and performance requirements.
Stay tuned for an upcoming academic paper, as well as the SpaceNet 7 model release blog and a blog detailing the dynamic components of SpaceNet 7.
This blog was originally published on The DownLinQ.